Visualize Earnings Trends with Bubble Chart V2
Product Description
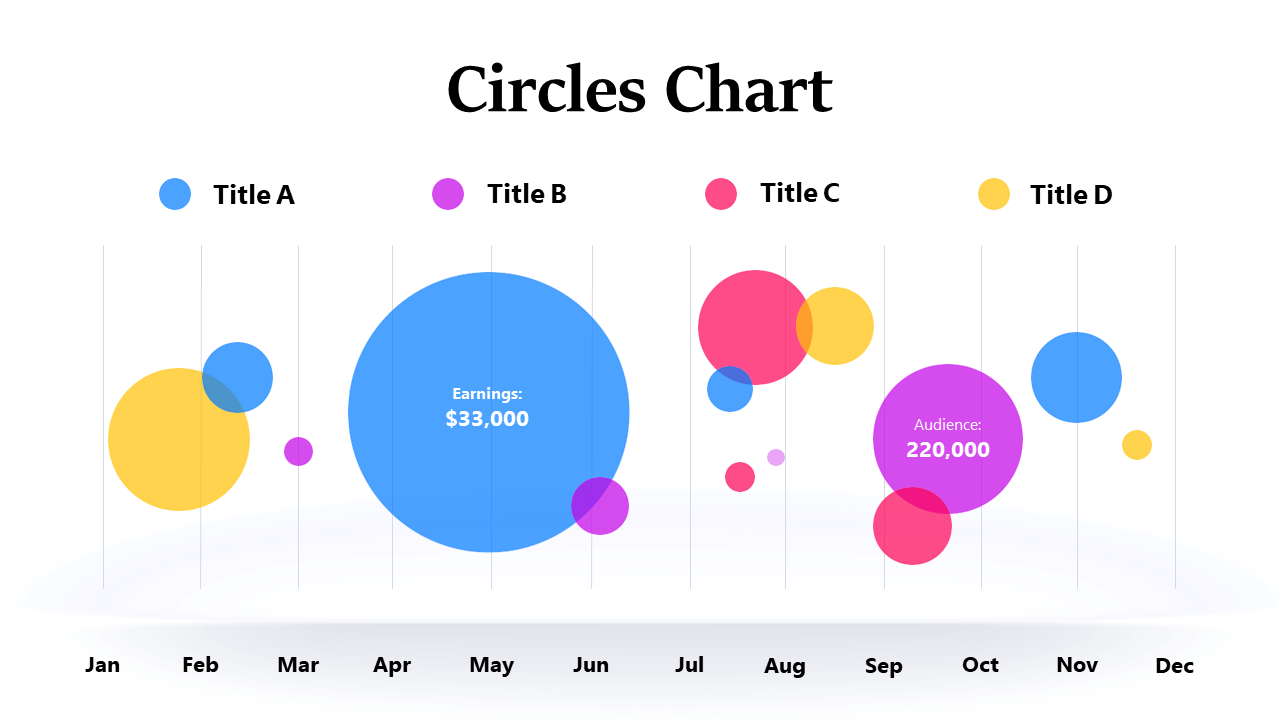
When presenting earnings trends, it can be tough to make the information stick without overwhelming your audience. This bubble chart simplifies the visualization of complex data, allowing you to highlight significant patterns and trends at a quick glance.
Turn your earnings discussions into engaging visuals that capture attention and drive understanding. This slide is perfect for finance professionals, marketing analysts, or any business leader who needs to convey earnings trends in meetings or reports. Imagine a product manager discussing revenue growth during a strategy session or an accountant presenting year-over-year comparisons to the executive team—this slide will help you illustrate your points effectively.
For only $0.99, you can download this bubble chart slide right now and start customizing it in PowerPoint or Google Slides. It’s user-friendly and ready to enhance your presentations within minutes, ensuring your data tells a compelling story.
$0.99 – Purchase Checkout
Added to cart







