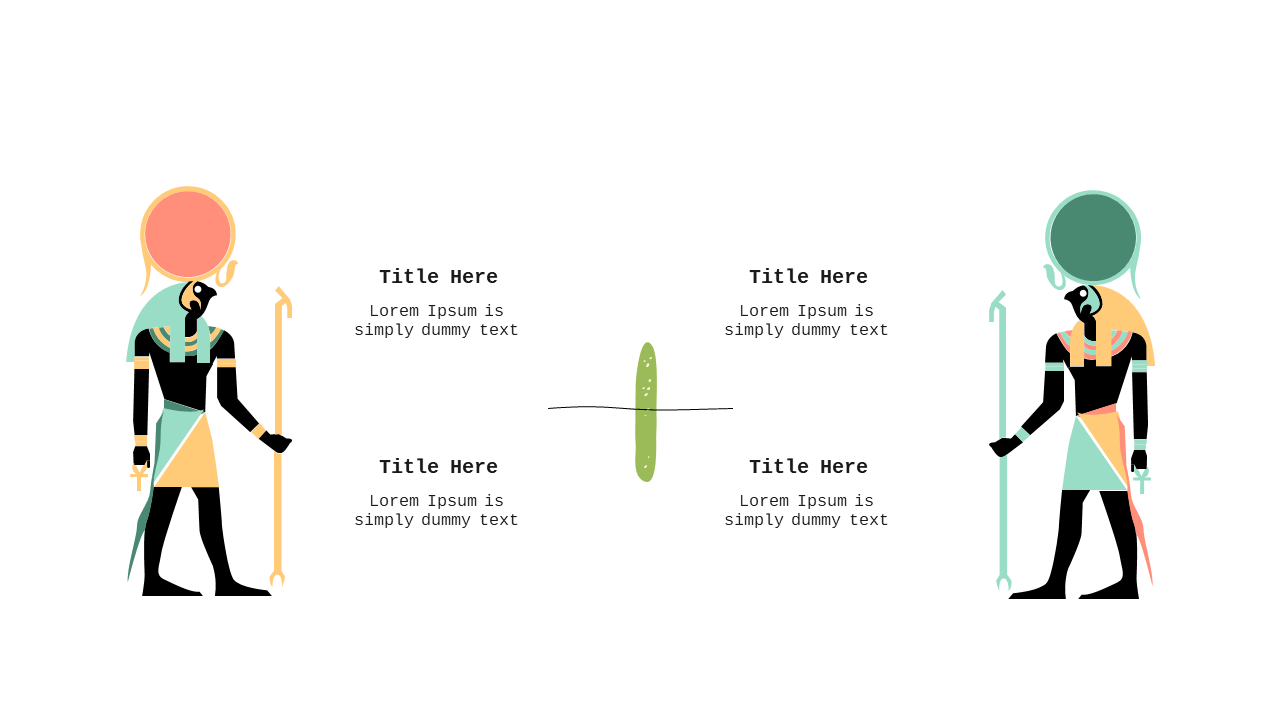
Balanced Comparison Layout with Illustrated Characters
Product Description
When you’re comparing different ideas or products, clarity can often be lost in the details. This balanced comparison layout provides a straightforward way to highlight contrasting elements, ensuring your audience understands the distinctions at a glance.
This slide is ideal for project managers evaluating competing software solutions, sales teams comparing product features, or marketing professionals presenting campaign options. The illustrated characters create a friendly and engaging environment, perfect for internal presentations or client meetings.
Available for just $0.99, this slide can be downloaded instantly and easily customized in PowerPoint or Google Slides. You’ll be able to create an effective comparison that resonates with your audience without any hassle.
$0.99 – Purchase Checkout
Added to cart