Visualize Australia’s COVID-19 Trends with Maps
Product Description
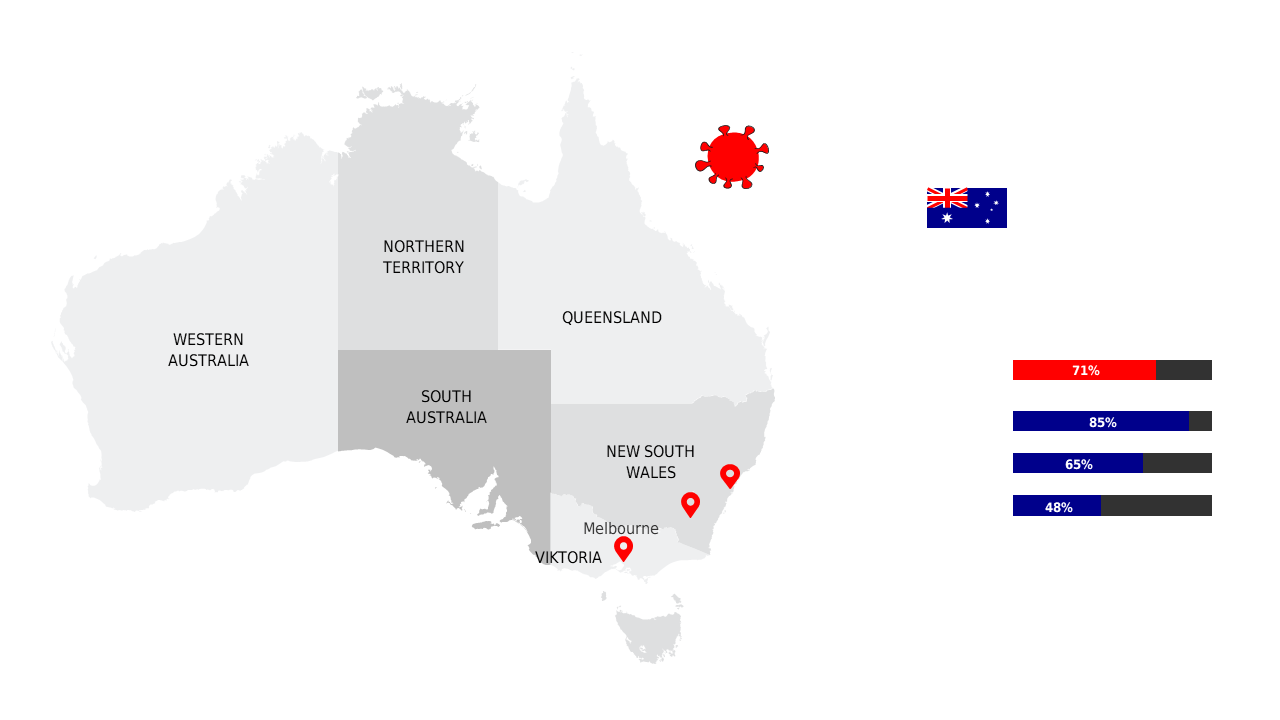
Finding a clear way to present complex COVID-19 data can be incredibly challenging, especially when you need to convey critical insights to a diverse audience. This slide provides a visual representation of Australia’s regional COVID-19 trends, making it easier for your viewers to grasp the situation at a glance.
Healthcare professionals, government officials, and educators can all benefit from this layout when discussing pandemic statistics. Whether you’re delivering a briefing to a healthcare board, a presentation to local policymakers, or a lecture to students, this slide will enhance your message and provide clarity.
At just $0.99, this slide is ready for immediate download and editing.
You can customize the map details, colors, and data points directly in PowerPoint or Google Slides, so you can create the perfect visual in no time.
$0.99 – Purchase Checkout
Added to cart







