Showcase Engagement with Audience Bar Chart
Product Description
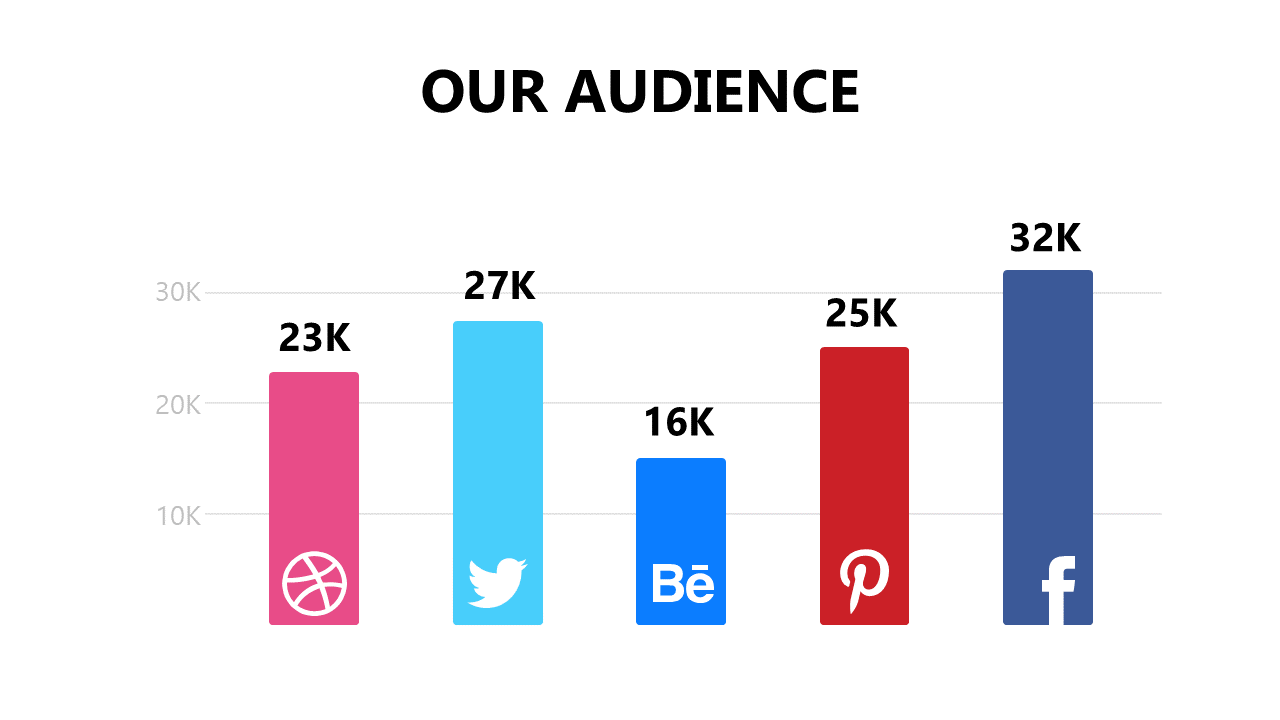
Demonstrating audience engagement across multiple social media platforms can be tricky when the data is complex and scattered. This bar chart layout simplifies that challenge, allowing you to compare and visualize engagement metrics clearly and effectively.
Marketing professionals and social media managers will find this slide essential for presentations on audience insights, campaign performance, or social media strategies. Whether you’re discussing analytics with your team or presenting to executives, this chart provides a clear view of your audience landscape.
At just $0.99, you can download this visually engaging slide instantly and edit it effortlessly in PowerPoint or Google Slides. Customize the chart to showcase your own data and get ready to impress your audience in no time.
$0.99 – Purchase Checkout
Added to cart







