Compare Social Media Engagement with Bar Chart V2
Product Description
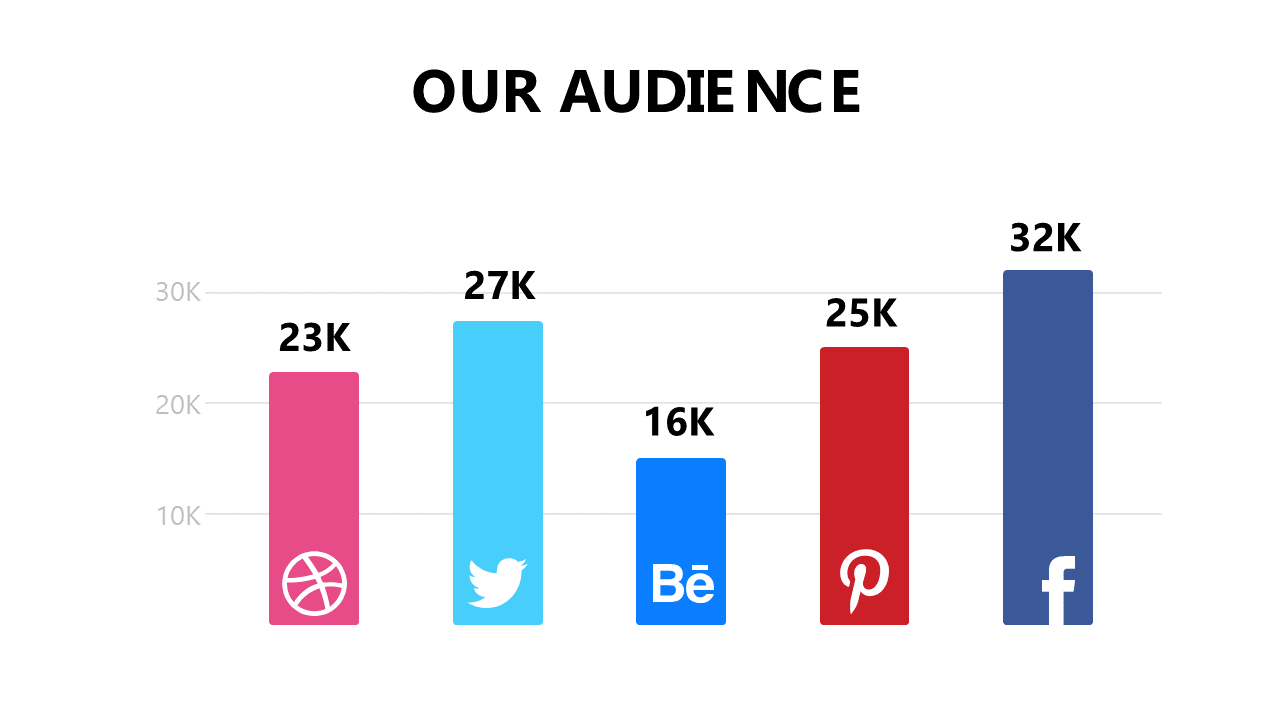
In today’s data-driven world, effectively conveying social media engagement trends can be a challenge, especially when you have diverse platforms to compare. This bar chart slide makes it simple to visualize and contrast engagement levels, transforming complex data into an easily digestible format.
Ideal for digital marketers, social media strategists, and data analysts, this slide is perfect for use in performance reviews, marketing strategy meetings, or campaign evaluations. You’ll be able to present clear comparisons, ensuring your audience can quickly grasp critical insights.
For only $0.99, this bar chart is available for instant download and can be easily edited in PowerPoint or Google Slides. Tailor it to your specific needs, and you’ll be ready to deliver a compelling presentation in just a few minutes.
$0.99 – Purchase Checkout
Added to cart







