Visualize Percentages with Arrow Breakdown Layout
Product Description
In a world filled with complex data, presenting your statistics clearly is vital. Your audience deserves a visually engaging way to understand percentages without feeling overwhelmed.
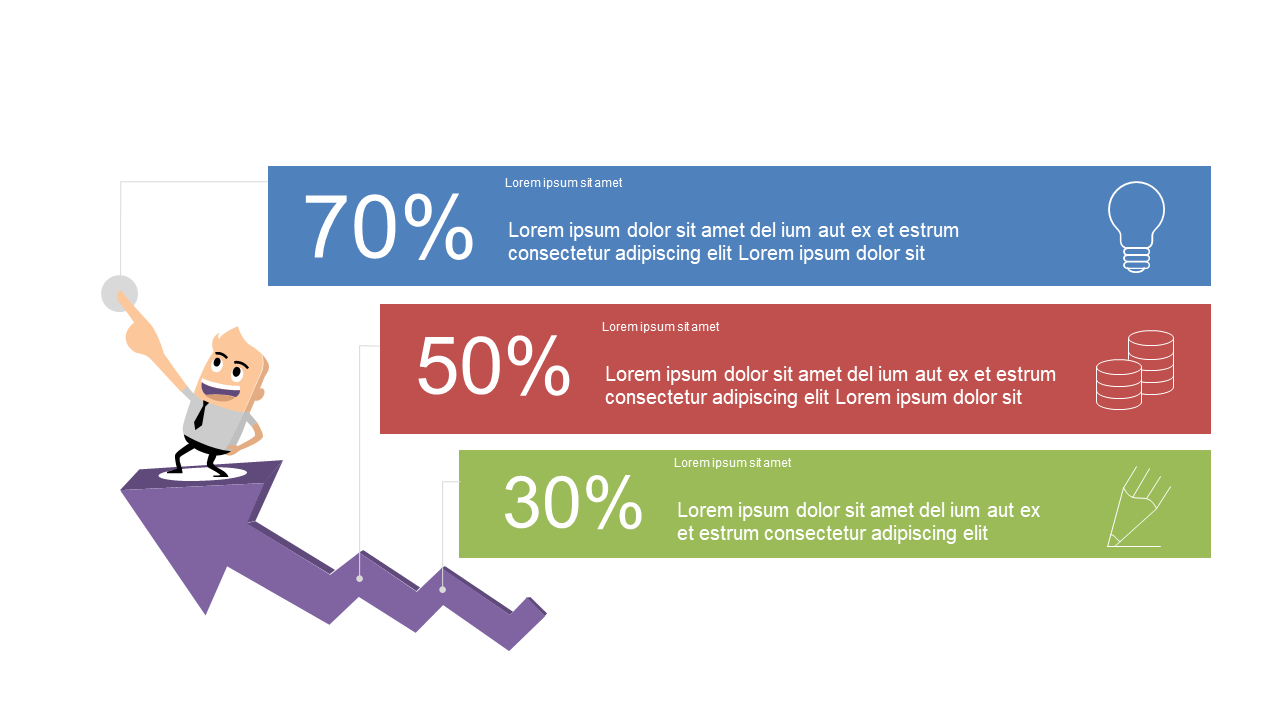
This arrow breakdown layout makes it easy to highlight important figures while capturing attention at the same time. This slide is particularly useful for financial analysts showcasing revenue reports, sales professionals presenting conversion rates, or marketers discussing campaign performance. Whether you’re in a boardroom meeting or a client pitch, this layout helps you deliver your data in a way that resonates.
At just $0.99, you can download this slide immediately and start editing in PowerPoint or Google Slides. With minimal effort, you’ll have a powerful visual tool that helps your audience grasp your data’s significance quickly.
$0.99 – Purchase Checkout
Added to cart







