Visualize Data Analysis with Engaging Magnifying Glass Layout
Product Description
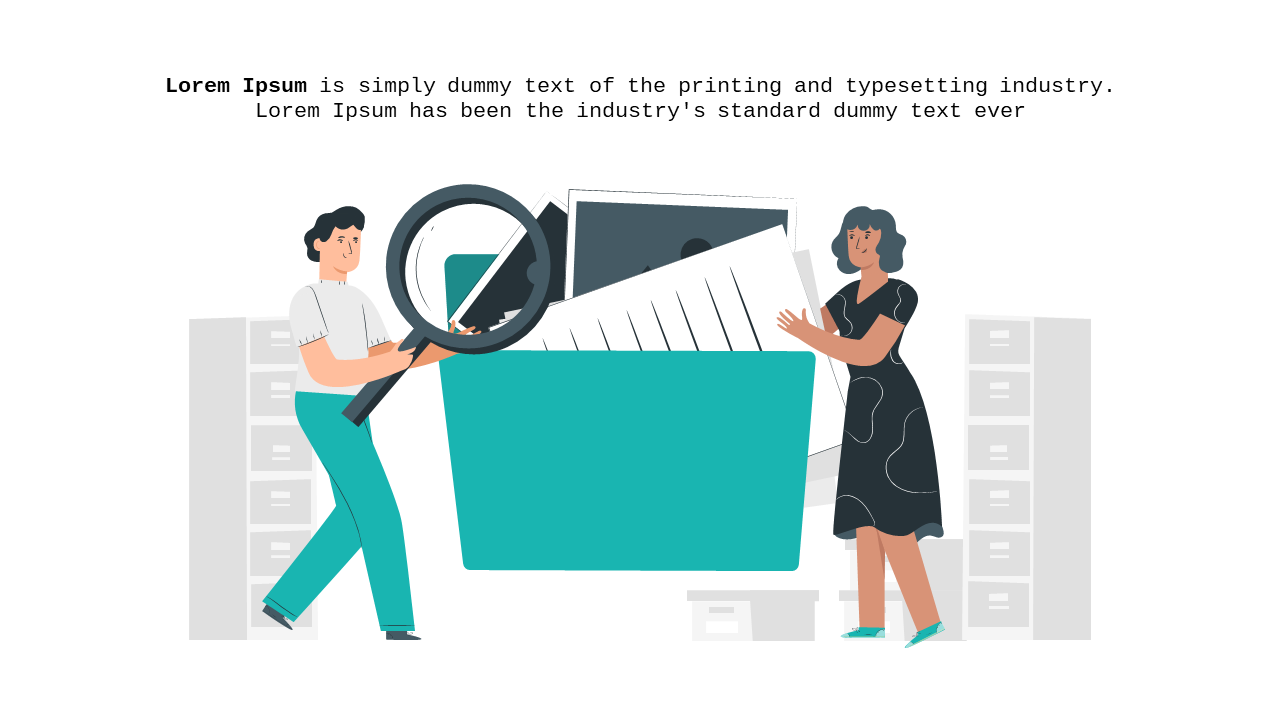
In a data-driven world, effectively presenting your analysis can often feel overwhelming. If your audience is struggling to grasp intricate details, this slide provides a compelling solution with its magnifying glass layout that draws focus. It captures attention while clearly conveying the need for meticulous examination of data points.
Data analysts, researchers, and business strategists will find this slide invaluable for their presentations. Whether you’re breaking down quarterly performance metrics or presenting research findings, this slide helps articulate your key insights.
Its engaging design keeps your audience focused on the information that matters most. For just $0.99, this slide is readily available for instant download and can be easily edited in both PowerPoint and Google Slides. Customize it to suit your analysis and enhance your data presentations within minutes.
$0.99 – Purchase Checkout
Added to cart







