Showcase KPI Progress with 3D Step Layouts
Product Description
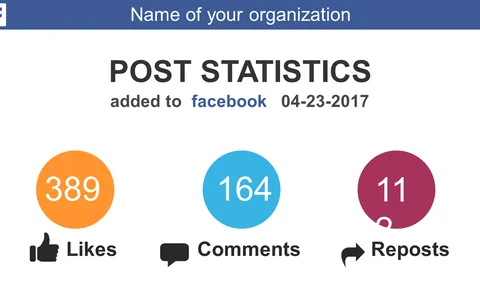
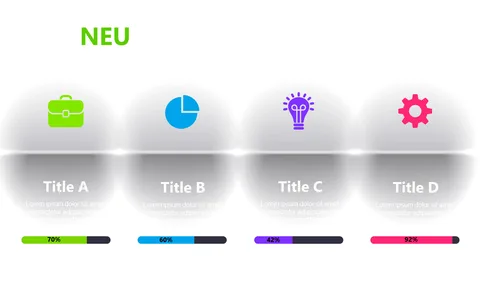
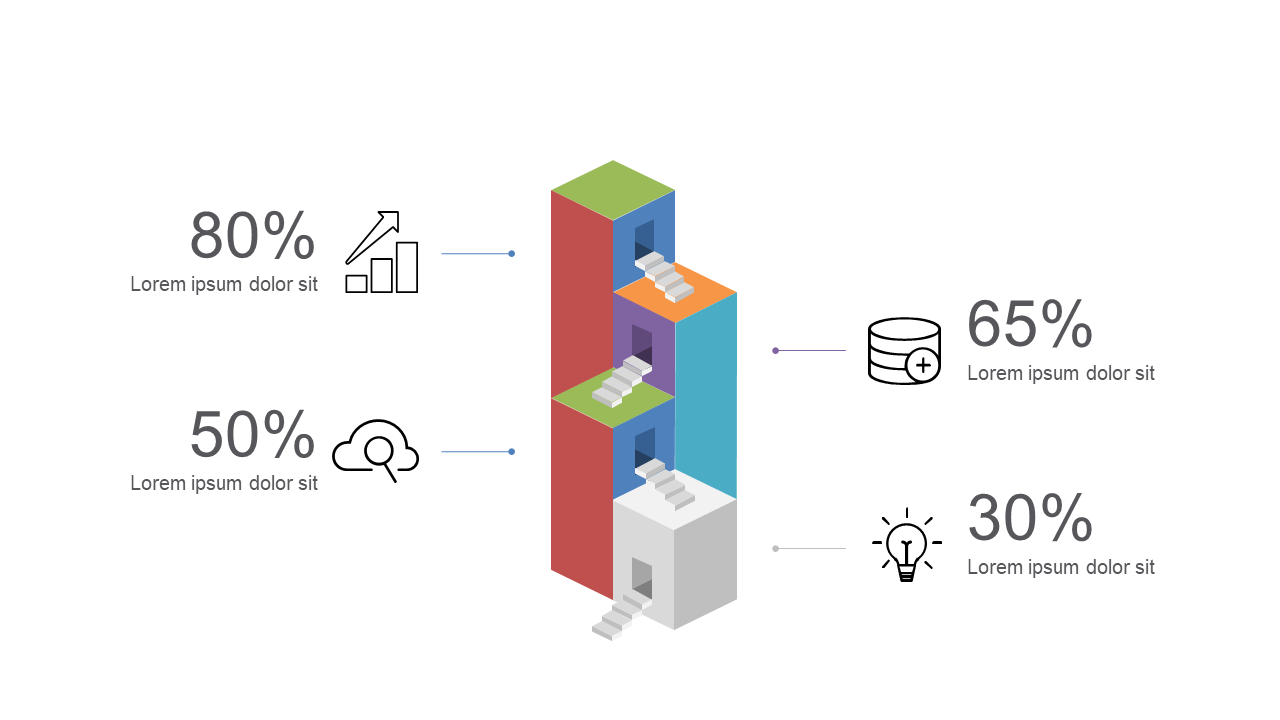
When it comes to presenting Key Performance Indicators, clarity is essential for effective communication. This stunning 3D step layout makes it simple to highlight your KPI progress, allowing your audience to grasp performance trends at a glance.
It’s designed to bring your key metrics to life in a visually engaging way. Use this slide when you’re a marketing manager reporting on campaign effectiveness, an HR professional discussing employee performance, or a team leader outlining project milestones. It’s perfect for meetings that require clear data visualization, such as performance reviews or strategic planning sessions.
For only $0.99, you can quickly download this slide and start editing in either PowerPoint or Google Slides. It’s ready in minutes, making it easy to enhance your presentations right away!
$0.99 – Purchase Checkout
Added to cart