Represent Growth Data with 3D Chart Layout
Product Description
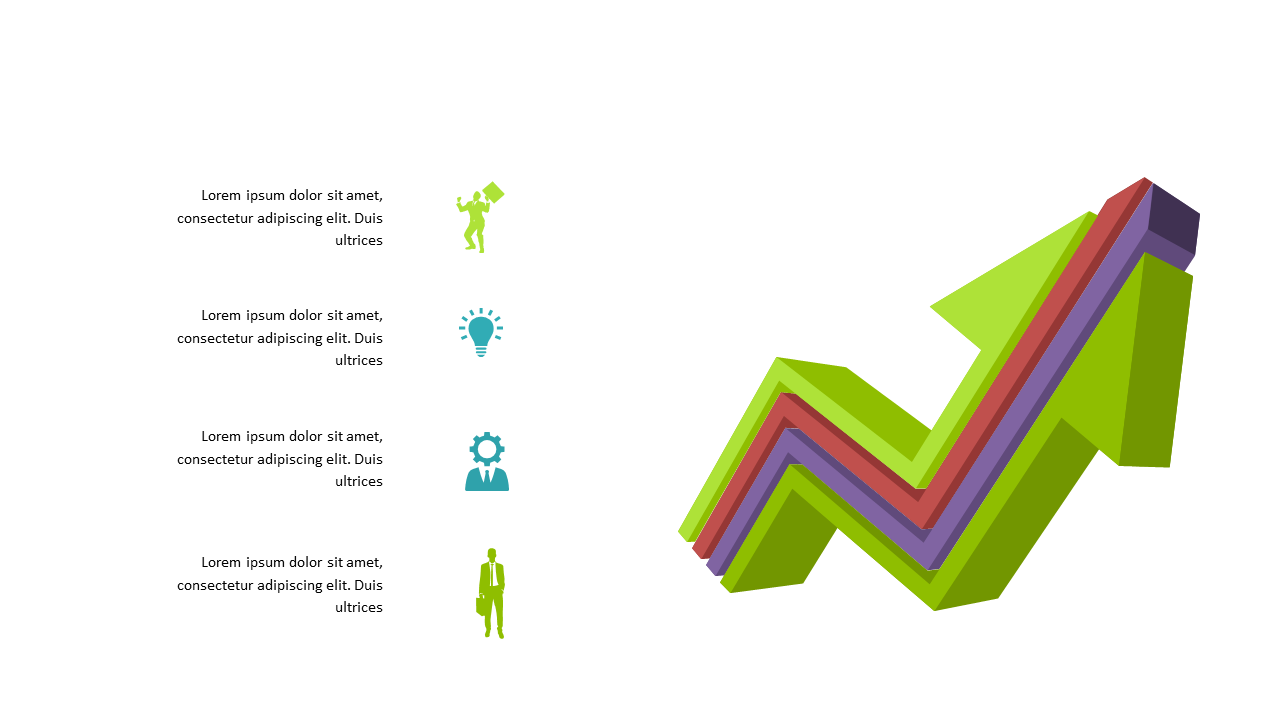
Presenting growth data can often feel like trying to decode a foreign language, especially when complex trends are involved. You want your audience to grasp the story behind the numbers without getting lost in the details. This dynamic 3D chart layout visually simplifies data, making it easier to convey insights at a glance.
Financial analysts, project executives, and business consultants can utilize this slide during quarterly reviews or strategic planning sessions. Picture using it to present growth metrics during a board meeting, where the clear visuals help to illustrate your points effectively.
It’s a great way to keep your audience engaged and make data-driven discussions more accessible. For just $0.99, this slide is ready for instant download, making it easy to incorporate into your next presentation. You can edit it with ease in PowerPoint or Google Slides, enabling you to personalize it to your style in no time.
$0.99 – Purchase Checkout
Added to cart







