Engage Audiences with 3D Circular Data Diagram
Product Description
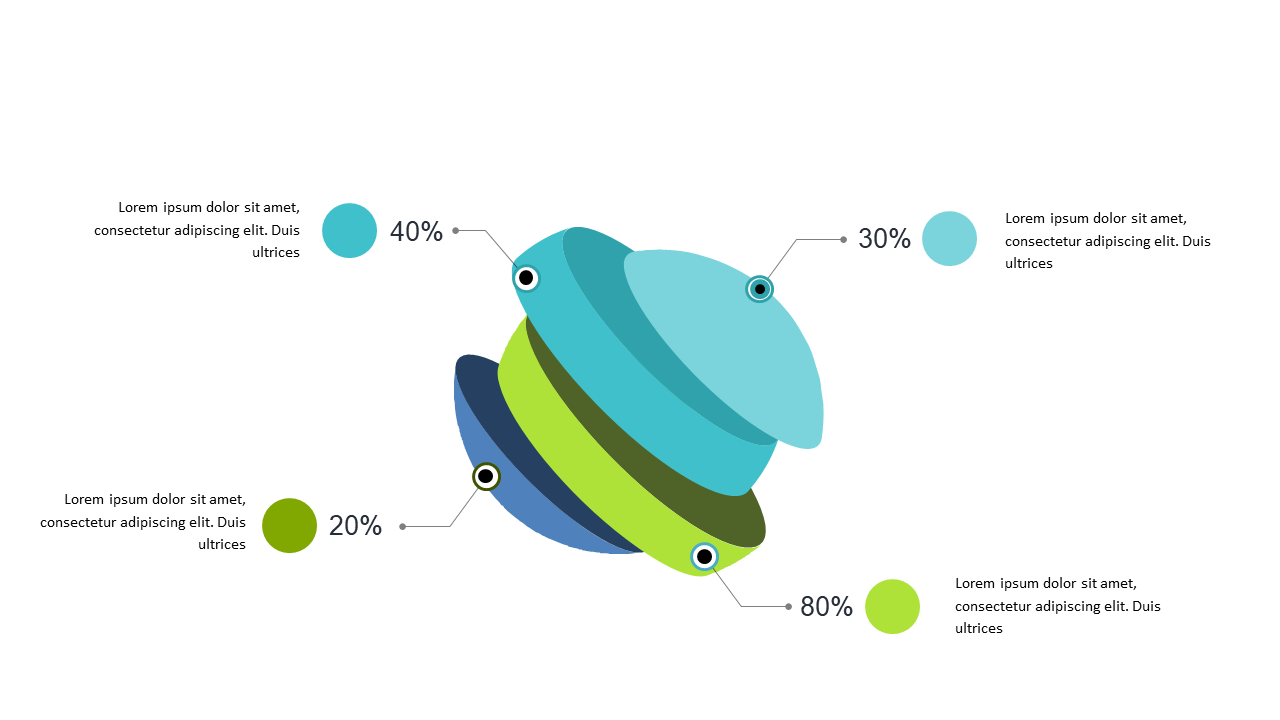
Making complex data presentations interesting can feel like a daunting task, especially when you have to convey intricate details quickly. This 3D circular data diagram changes the game by transforming percentage distributions into an eye-catching format that not only captures your audience’s attention but also simplifies the information presented. Picture your next quarterly review, where highlighting trends becomes a breeze.
Data analysts, financial consultants, and marketing specialists will find this slide particularly useful during reports, strategy sessions, and client meetings. Whether you’re breaking down sales figures or visualizing market share, this diagram helps your audience grasp essential insights without feeling overwhelmed. Imagine the confidence you’ll have knowing that your data is being presented clearly and engagingly.
For just $0.99, you can instantly download this slide and start using it right away. It’s easily customizable in PowerPoint and Google Slides, so you can adjust it to fit your branding and presentation style without any hassle. Your next presentation is just moments away from being more effective!
$0.99 – Purchase Checkout
Added to cart







