Showcase Data Trends with 3D Bar Graphs
Product Description
When it comes to showcasing data trends, clarity is key, yet many visuals fall short of making complex information easily digestible. You need an engaging way to highlight trends without overwhelming your audience.
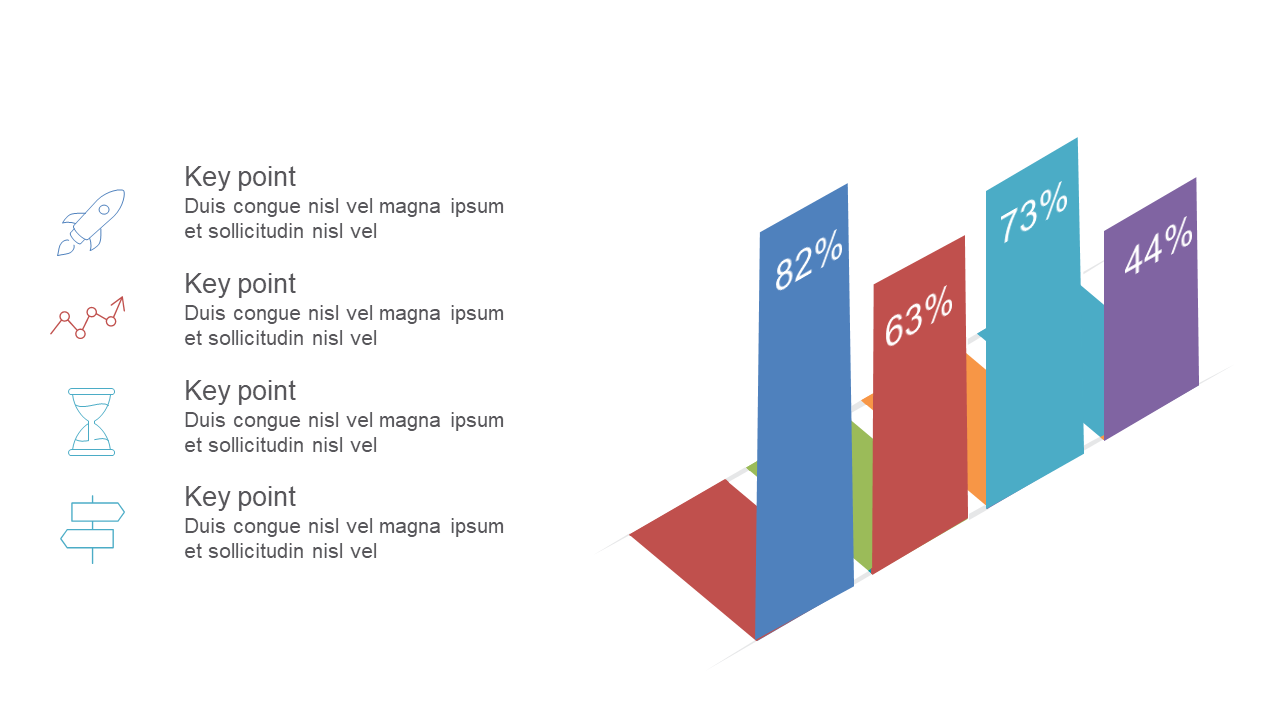
This slide features a stunning 3D bar graph that simplifies your data storytelling, bringing your findings to life. Data analysts, financial officers, and market researchers can use this slide during quarterly reports, team briefings, or client presentations. The clean design allows you to focus on communicating your insights without losing your audience in the numbers, ensuring they grasp the trends that matter most.
At just $0.99, this slide is available for instant download and is easy to modify in PowerPoint or Google Slides. You won’t waste time formatting; just plug in your data and you’re ready to go in minutes.
$0.99 – Purchase Checkout
Added to cart







