Key Metrics Comparison with Icons

Product Description
When you’re tasked with presenting conflicting performance indicators or project outcomes, it can be hard to communicate the differences clearly. A cluttered slide can confuse your audience and detract from your message, making it critical to have a clear and engaging way to compare key metrics.
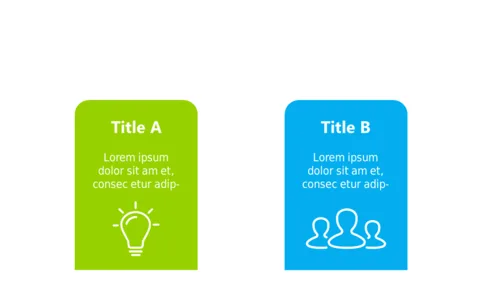
This slide helps you present vital information in a straightforward manner that everyone can grasp at a glance. You’ll find this slide beneficial if you’re a project manager showcasing results from different phases of a project, a sales director comparing quarter-over-quarter performance, or an operations manager reporting on efficiency metrics. Each section’s icons and text can be easily modified to suit your specific data, ensuring that your audience gets what they need from your presentation.
For just $0.99, you can download this slide and easily edit it to match your needs in PowerPoint or Google Slides. Complete your presentation in minutes and give your metrics the attention they deserve.
$0.99 – Purchase Checkout
Added to cart