Compare Two Options with Speech Bubbles
Product Description
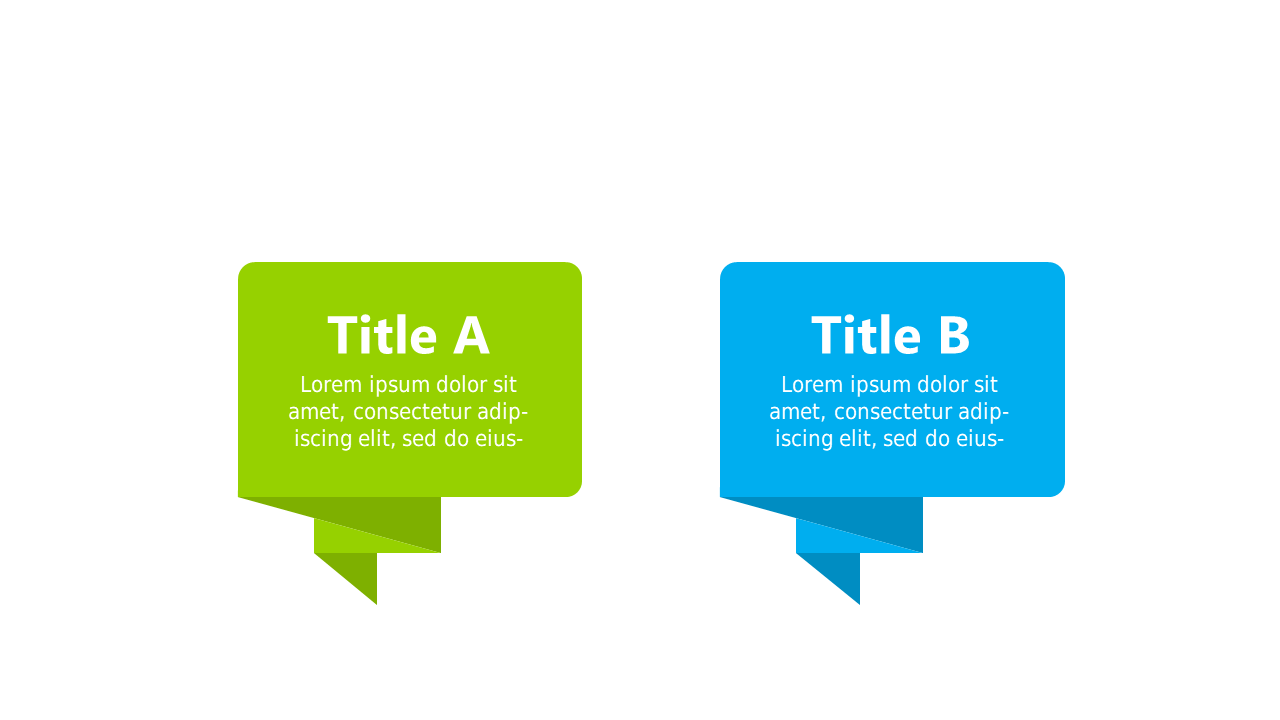
When you want to compare two options, making that information digestible can be tricky. This layout showcases two colorful speech bubbles, inviting your audience to engage with the content while clearly outlining the differences between each option.
It’s a great choice for sales professionals evaluating different products, marketing teams debating campaign strategies, or educators discussing contrasting ideas. The speech bubble design adds a conversational tone that enhances understanding in various contexts.
At a price of just $0.99, this slide is available for instant download. It’s fully editable in PowerPoint and Google Slides, allowing you to adapt the text and colors to your specific needs in just a few clicks.
$0.99 – Purchase Checkout
Added to cart