Effective Side-by-Side Product Comparison
Product Description
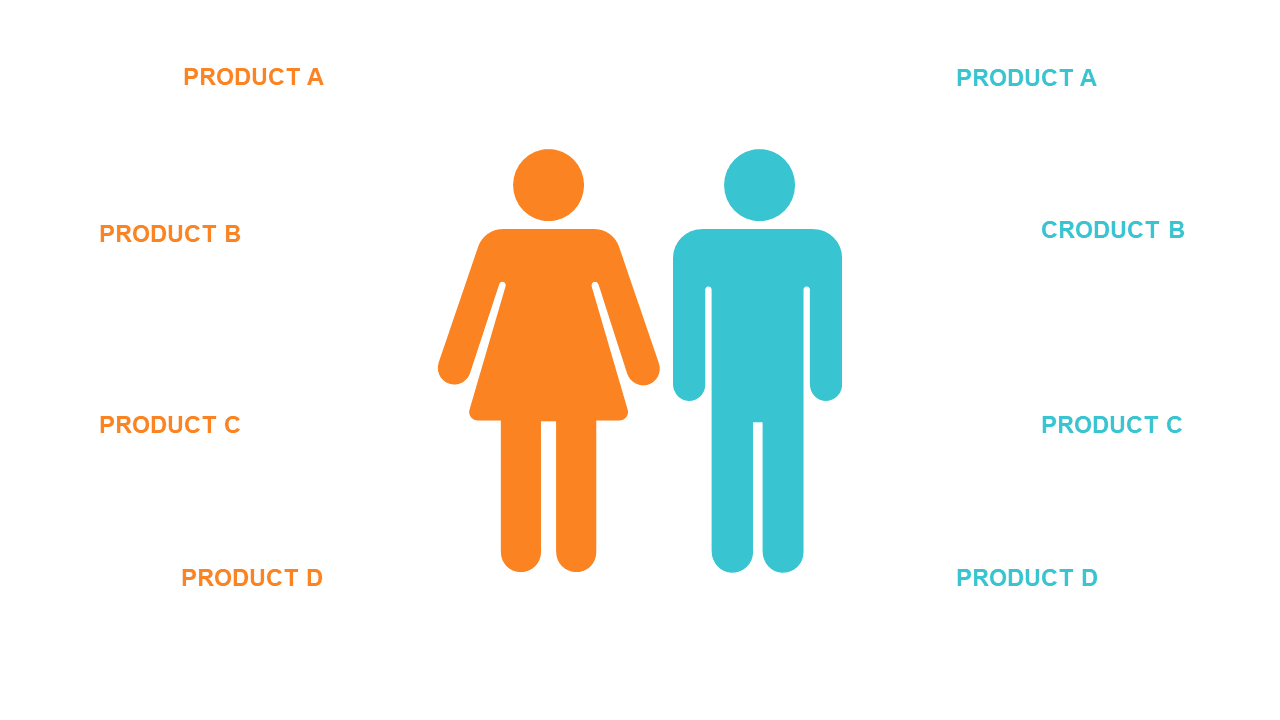
When comparing products, presenting the differences clearly can be a daunting task. You want to ensure your audience grasps the key advantages without getting lost in details. This slide simplifies that process, featuring a side-by-side comparison layout with two central icons representing different demographics, flanked by clear product comparisons.
Marketing professionals conducting competitive analysis, product managers showcasing features, or sales teams presenting options to clients will find this layout invaluable. It works well in meetings where decisions need to be made quickly, such as product launches, vendor evaluations, or client consultations, ensuring clarity and engagement throughout.
For just $0.99, this slide is available for instant download and offers easy editing options. You can modify product names and colors in both PowerPoint and Google Slides, tailoring it to your specific needs in minutes. Don’t miss the opportunity to make your product comparisons more effective with this engaging layout!
$0.99 – Purchase Checkout
Added to cart