Display Smartwatch Data with Annotations
Product Description
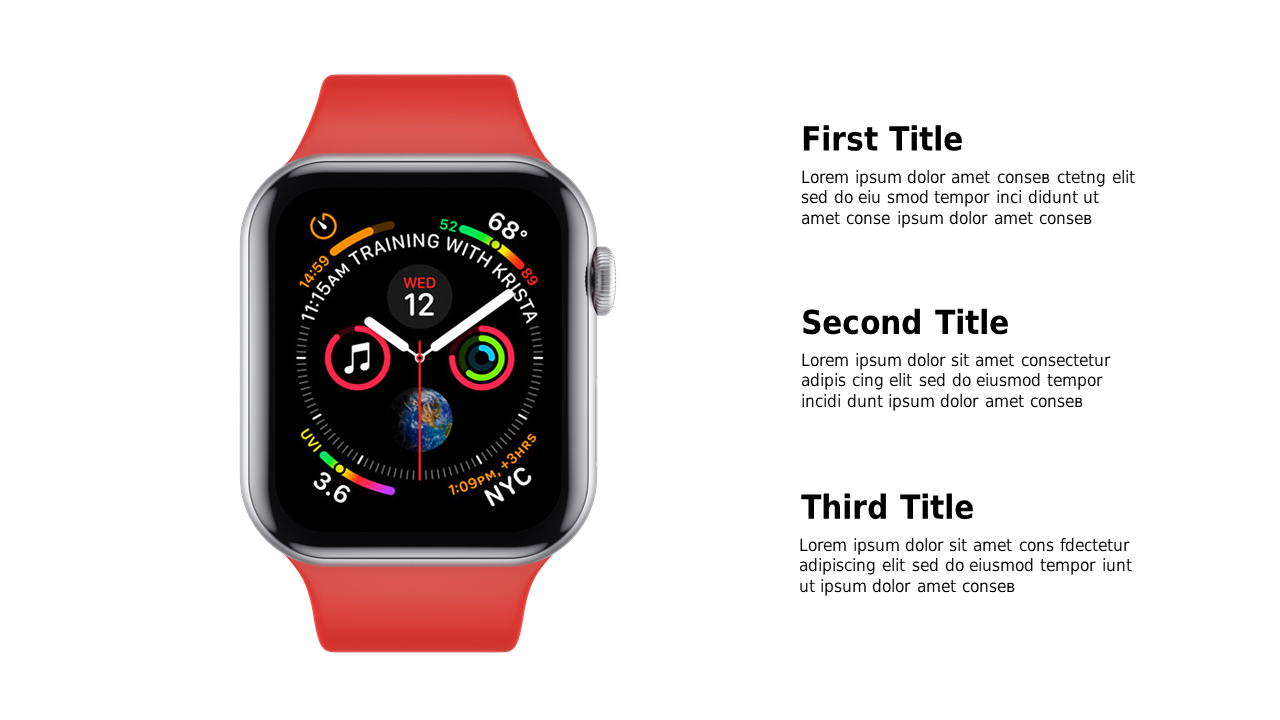
Communicating complex data, especially from wearable technology, can often be confusing for your audience. This slide tackles that difficulty by visually presenting smartwatch data, complete with annotations that make it simple to understand key insights at a glance.
It’s all about making data accessible. Data analysts, tech presenters, and product marketers will appreciate this slide during technical presentations or performance reviews. When you’re trying to convey detailed information on smartwatch metrics in a clear way, this layout serves as an effective tool to enhance comprehension and engagement.
Download this slide for just $0.99, and you’ll find it ready for your use in minutes. Editing it is straightforward in both PowerPoint and Google Slides, allowing you to make the data your own without any fuss.
$0.99 – Purchase Checkout
Added to cart