Engaging Circular Progress Indicators for Business Milestones
Product Description
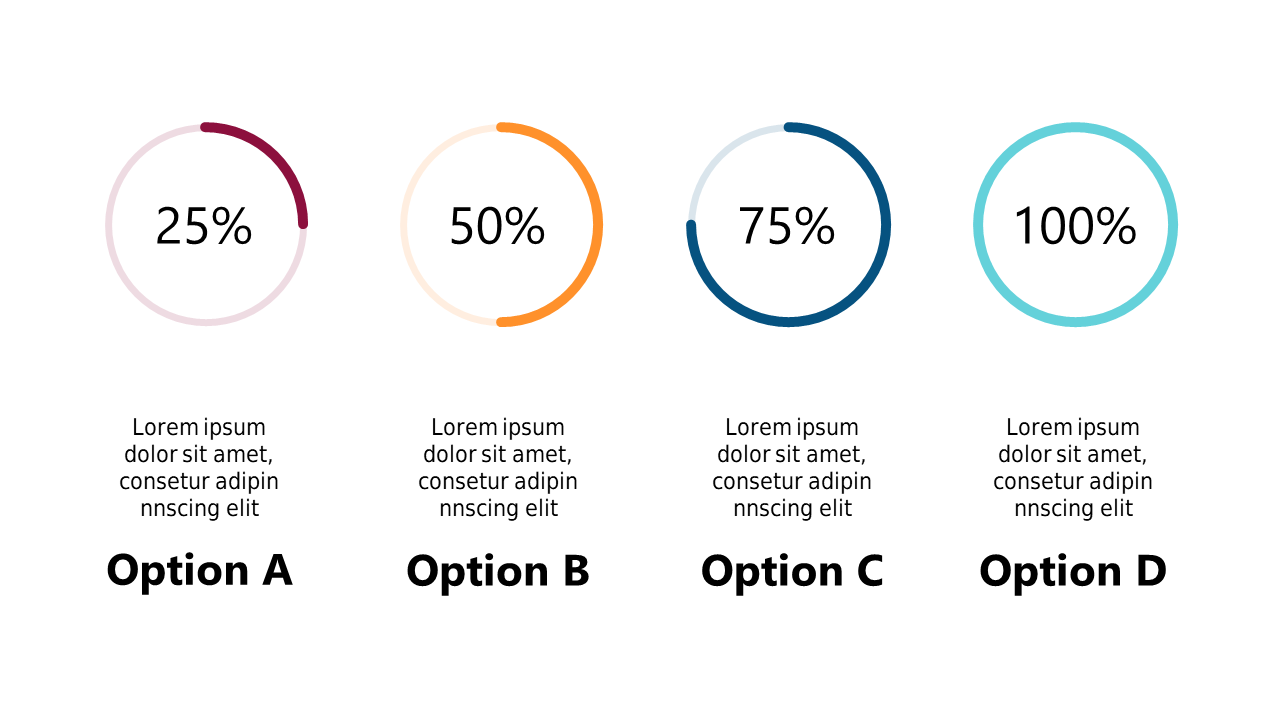
Keeping your audience engaged while presenting data can be tough, especially when numbers and statistics start to blur together. Engaging circular progress indicators make it easy to clearly communicate milestones, helping your audience visualize achievement levels in a way that’s both informative and captivating.
This slide is perfect for project managers highlighting progress during team meetings, marketing professionals showcasing campaign achievements, or operations managers detailing process stages to their teams. Whether you’re in tech, marketing, or any industry with ongoing projects, these visual indicators will clarify your points and keep everyone on the same page.
At just $0.99, you can instantly download this slide and easily edit it in PowerPoint or Google Slides. Customize the progress percentages and text labels to fit your needs and make your presentations shine in minutes.
$0.99 – Purchase Checkout
Added to cart







