Display Financial Data Points on a World Map
Product Description
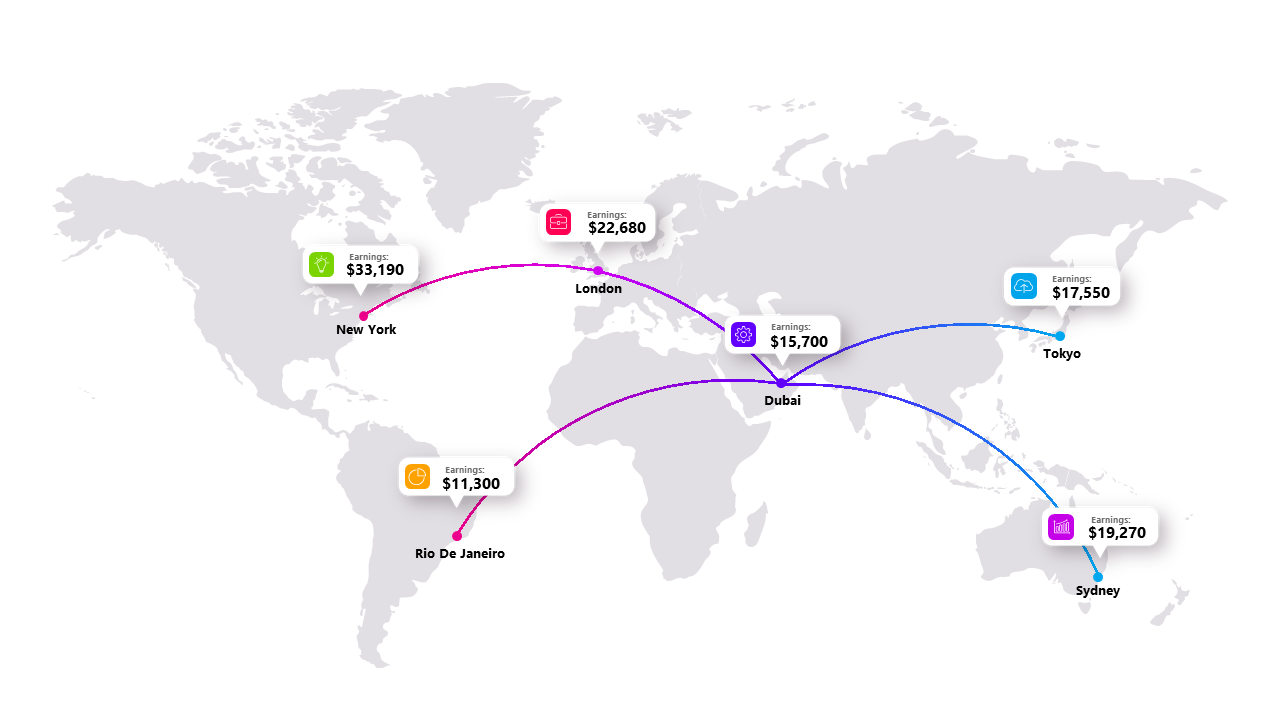
When it comes to delivering financial insights across different regions, plain numbers don’t do your message justice. A world map with visualized data points not only captivates your audience but also helps them grasp the significance of the information at a glance.
This layout suits roles such as business analysts, financial consultants, and regional managers, especially in meetings where cross-border performance data is discussed. Picture a strategic meeting where you need to illustrate market penetration in Asia versus Europe; this slide helps you tell that story effectively.
For only $0.99, you can download this slide and start editing it to fit your presentation needs. Customize the data points and visuals in just a few clicks, and feel confident delivering your insights in both PowerPoint and Google Slides.
$0.99 – Purchase Checkout
Added to cart







