Visualize Global Financial Insights on a Map
Product Description
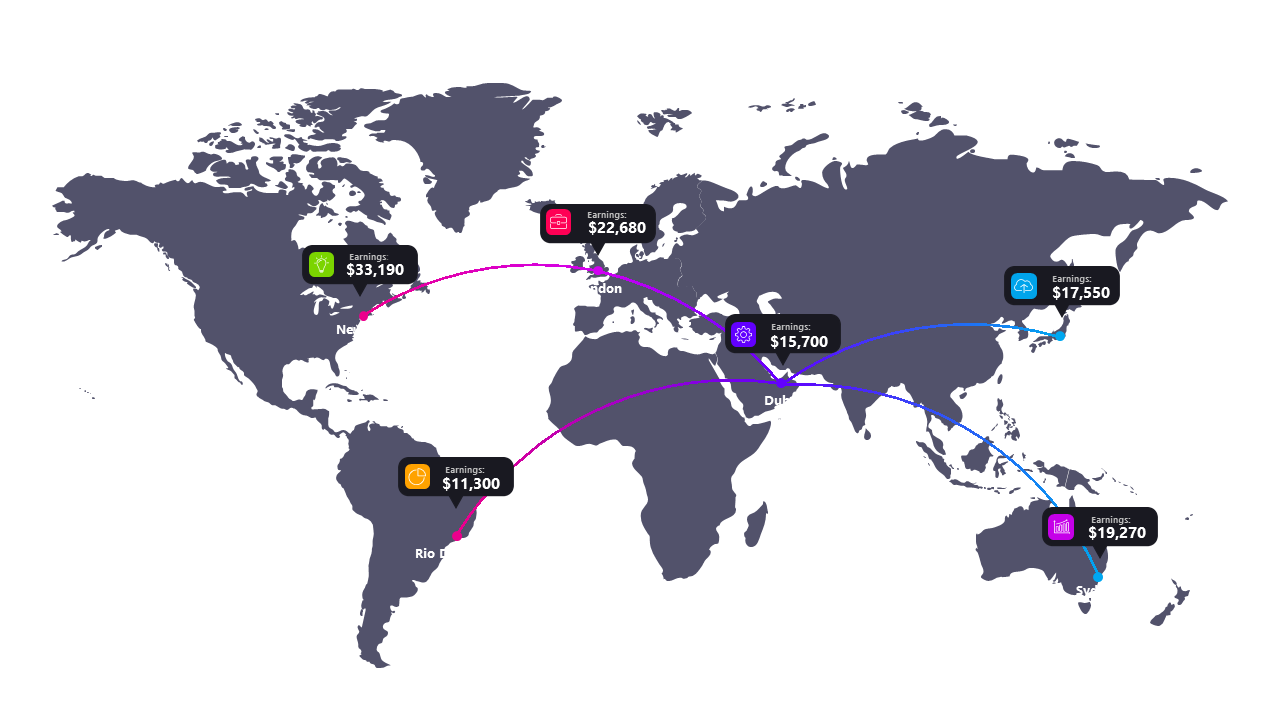
Trying to make sense of international financial statistics can leave your audience overwhelmed if all they see are numbers. A world map highlighting specific data points brings geographical context to your insights, making the information approachable and memorable.
You’ll find this slide particularly useful in industries like finance, marketing, or consulting, especially during quarterly reviews or strategy sessions. Whether you’re an investment banker discussing global markets or a business development manager pitching a new product, this layout elevates your presentation by connecting numbers to locations.
At just $0.99, this slide is ready for instant download and incredibly simple to edit. You can quickly tailor the data points and design to match your presentation style in both PowerPoint and Google Slides.
$0.99 – Purchase Checkout
Added to cart







