Present Business Performance with Five-Step Overview
Product Description
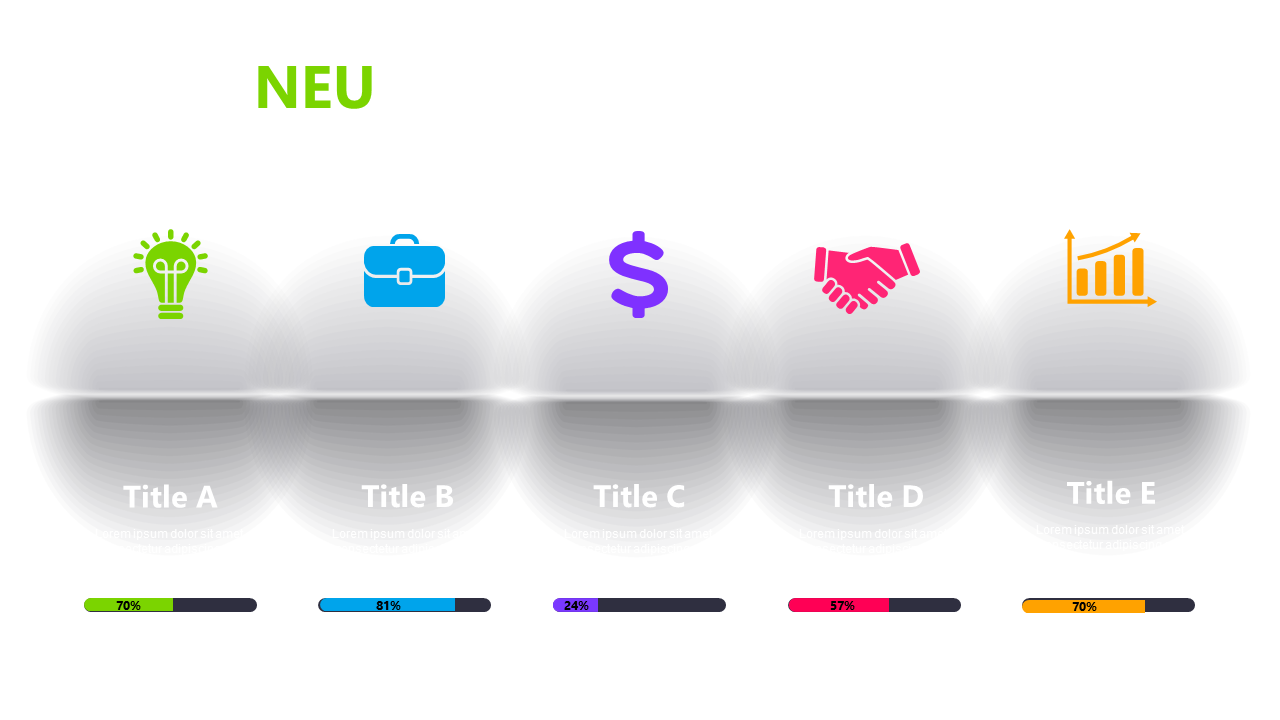
When you’re tasked with presenting multiple performance metrics, it can often lead to cluttered visuals that confuse your audience. This five-step overview layout organizes key performance indicators into distinct sections, making it easy for viewers to grasp essential information at a glance.
The use of icons and sliders adds a dynamic touch that keeps your presentation engaging. This slide is perfect for business analysts comparing data across various categories, finance professionals summarizing quarterly results, or managers looking to present team performance metrics. Whether in a boardroom meeting, an investor pitch, or a team review, this layout ensures your information is clear and compelling.
For $0.99, you can download this slide immediately, and it’s easy to edit in both PowerPoint and Google Slides. Tailor it to your specific data set and branding in just minutes, ensuring a polished and professional presentation.
$0.99 – Purchase Checkout
Added to cart







