Visualize Audience Segments with Percentage Distribution
Product Description
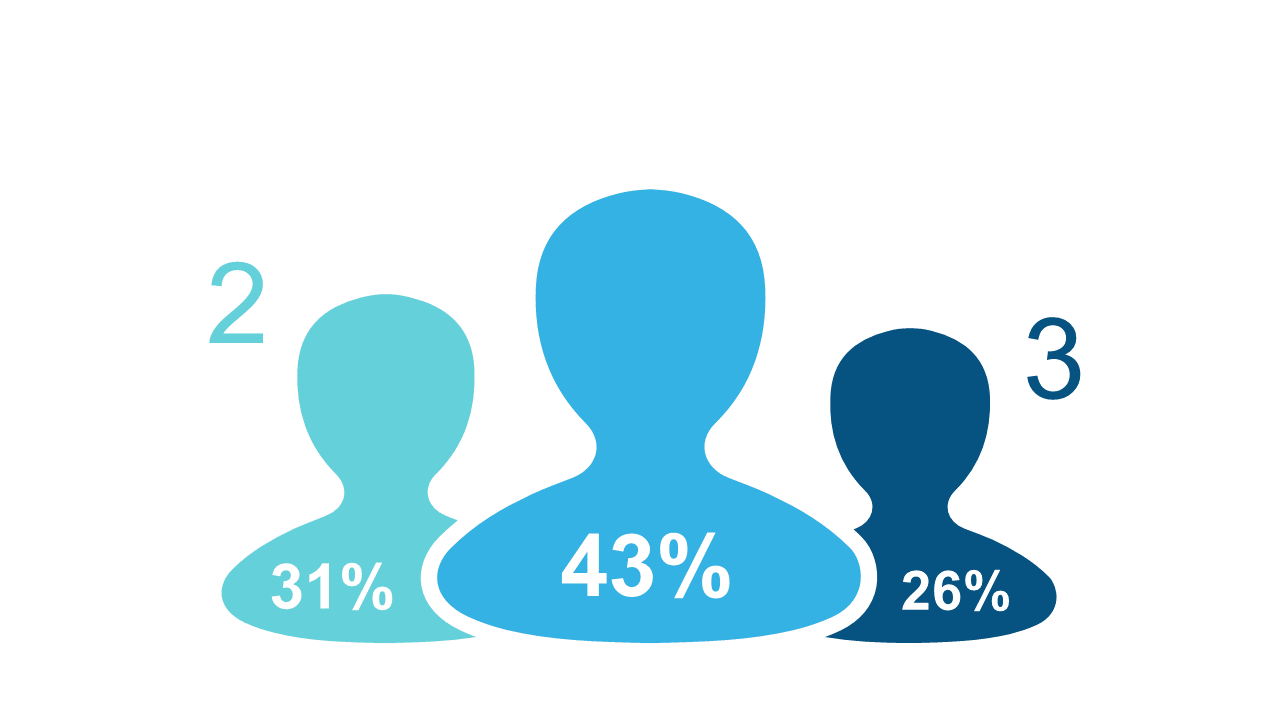
When dealing with varied audience segments, showcasing financial insights clearly is paramount to effective communication. This slide simplifies the visualization of percentage distributions using stylized human figures, making complex data relatable and easy to comprehend for your audience.
Use this layout in presentations ranging from financial analysis meetings to investor briefings, ensuring that your demographic insights are communicated clearly. Whether you’re discussing customer segments or market research, this visual representation will enhance your narrative.
For just $0.99, you can download this slide instantly and get started on editing. It’s compatible with PowerPoint and Google Slides, allowing for easy customization to fit your presentation style and requirements within minutes.
$0.99 – Purchase Checkout
Added to cart







