Show Data Trends with Colorful Pie Chart
Product Description
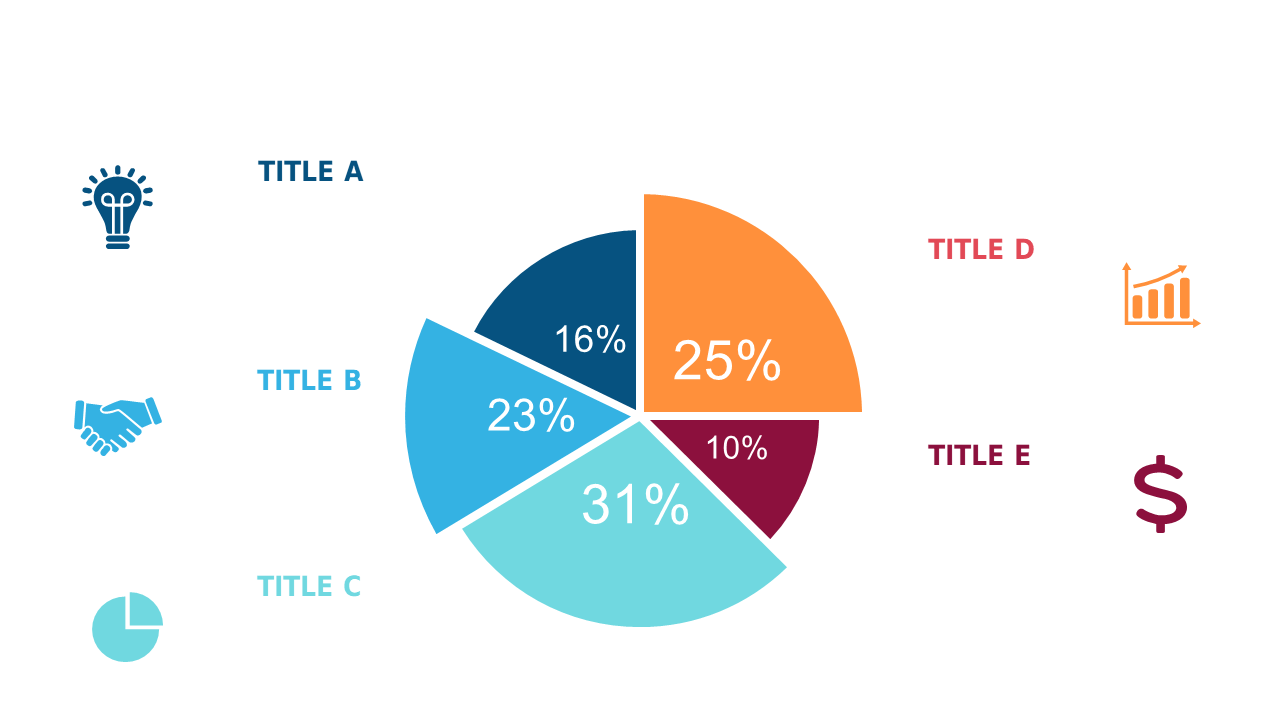
As a business analyst, you know that presenting complex data in a digestible way can be a daunting task. This colorful pie chart helps break down percentage distributions visually, transforming intricate information into engaging and understandable insights for your audience.
You’ll find this slide invaluable when presenting trends during quarterly reports, strategy meetings, or client updates. Whether you’re illustrating market segments or comparing resource allocations, this chart makes it easy to communicate your findings effectively.
For just $0.99, you can quickly download this slide and begin customizing it to suit your presentation style. It’s easy to edit in both PowerPoint and Google Slides, ensuring you can adapt it to fit your needs in no time.
$0.99 – Purchase Checkout
Added to cart







