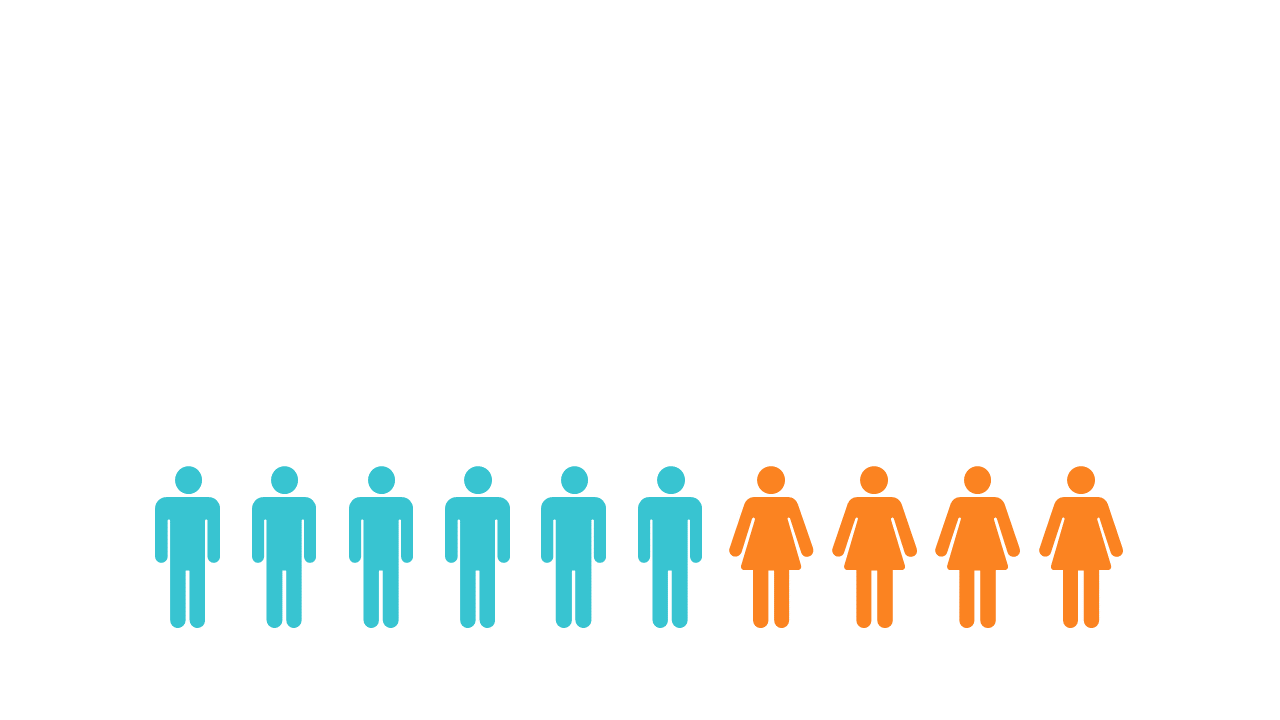
Present Gender Representation with Silhouette Chart
Product Description
Presenting gender demographics in a clear and impactful way can often be a struggle, especially when trying to convey complex statistics. This silhouette chart layout helps you visualize gender representation effectively, making it easier for your audience to grasp the data at a glance.
HR professionals, educators, and researchers will find this slide particularly useful in reports and presentations. Whether you’re discussing diversity initiatives in a company meeting or presenting findings at a conference, this layout allows you to engage your audience meaningfully with essential statistics.
For only $0.99, you can download this slide and start editing right away. It’s compatible with both PowerPoint and Google Slides, letting you tweak colors and shapes to match your theme in just minutes.
$0.99 – Purchase Checkout
Added to cart







