Visualize USA Data with Annotated State Map
Product Description
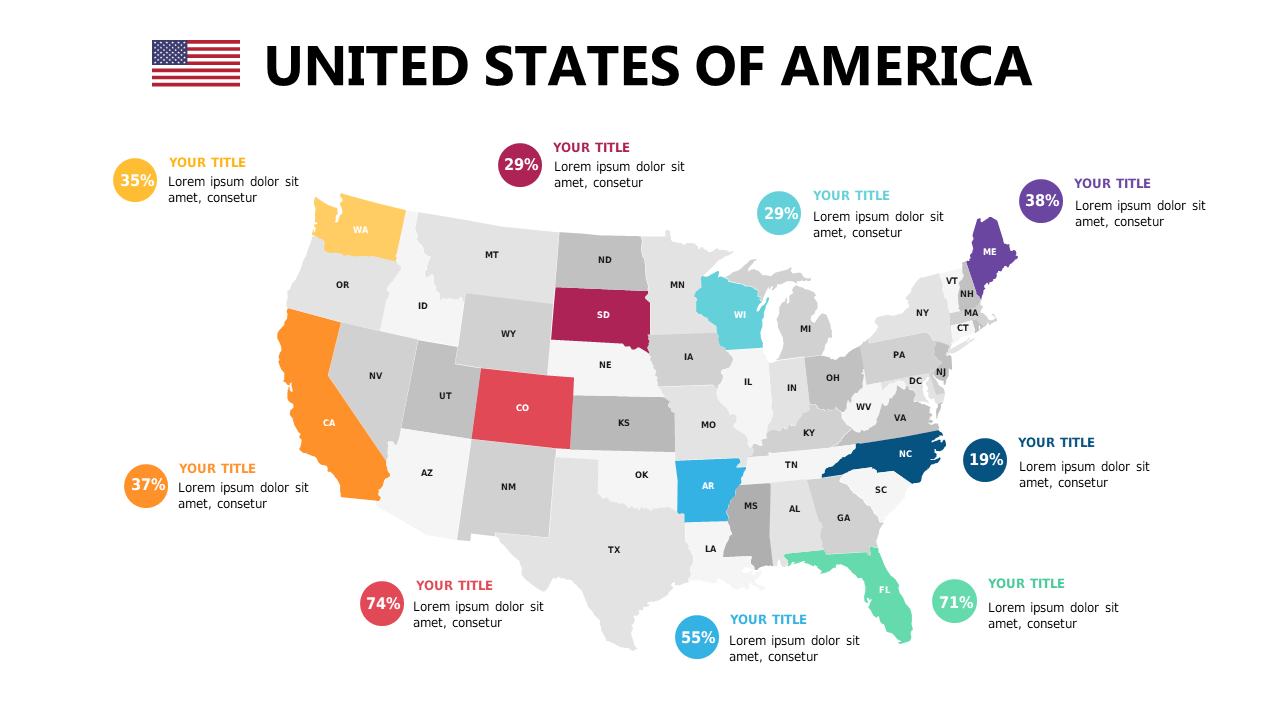
Finding a way to present statistical data across different states in the USA can often overwhelm your audience. This annotated state map allows you to clearly display percentages, making complex data much more accessible.
By visualizing your information in this way, you can drive home the significance of your findings without losing clarity. This slide is particularly useful for market researchers presenting data distributions, sales analysts assessing performance by region, or business development professionals identifying trends. Whether you’re in a team meeting or pitching to clients, this visual aid will help communicate your points effectively.
Available for just $0.99, this slide is ready for immediate download and easy customization in PowerPoint and Google Slides. Make quick edits to the annotations and get your presentation up and running within minutes.
$0.99 – Purchase Checkout
Added to cart







