Showcase Data Trends with Gradient Area Chart
Product Description
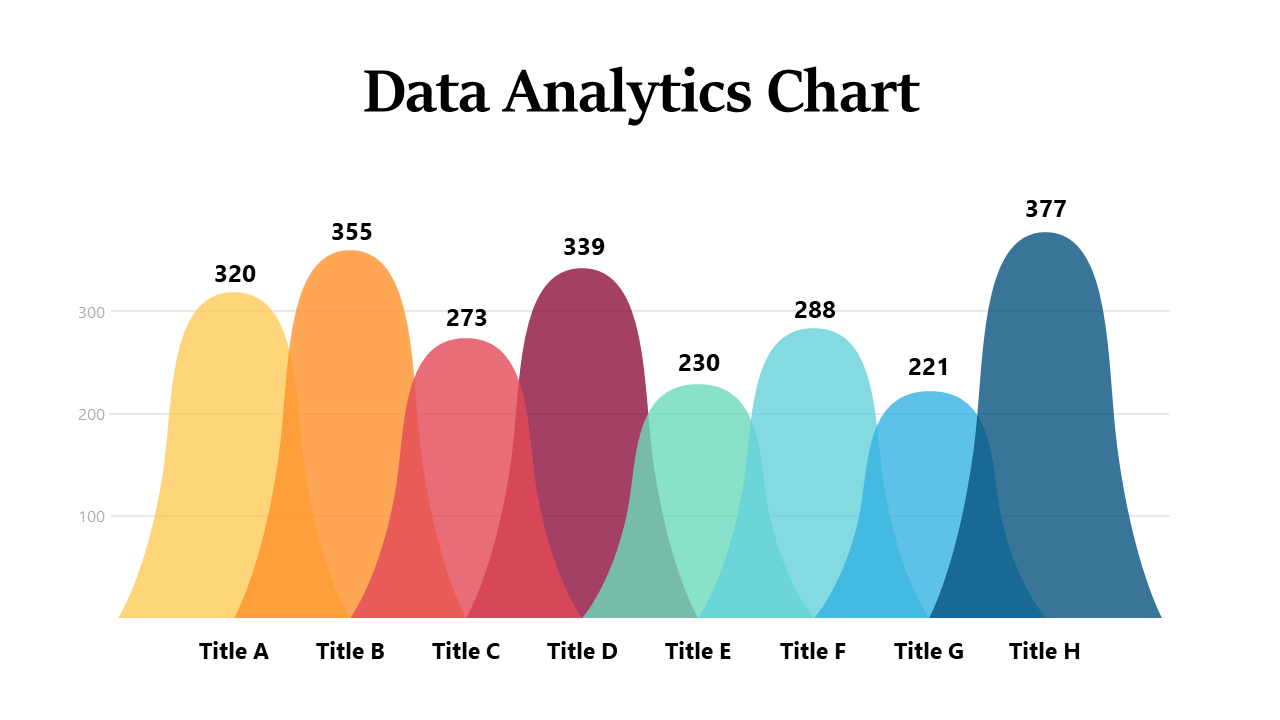
Making data trends easily understandable is no small feat, especially when presenting detailed information to a diverse audience. This slide’s gradient area chart offers a straightforward way to highlight those trends over time, helping your viewers see the bigger picture.
It’s a great resource for business consultants delivering insights during client meetings, where illustrating market shifts is essential. Additionally, product managers can utilize it to track user engagement metrics, making sure their data communicates effectively across teams.
Available for only $0.99, this slide is ready for instant download and can be customized in both PowerPoint and Google Slides. With just a few tweaks, you’ll be able to present your data beautifully in no time.
$0.99 – Purchase Checkout
Added to cart







