Engaging U.S. Heat Map for Presentations
Product Description
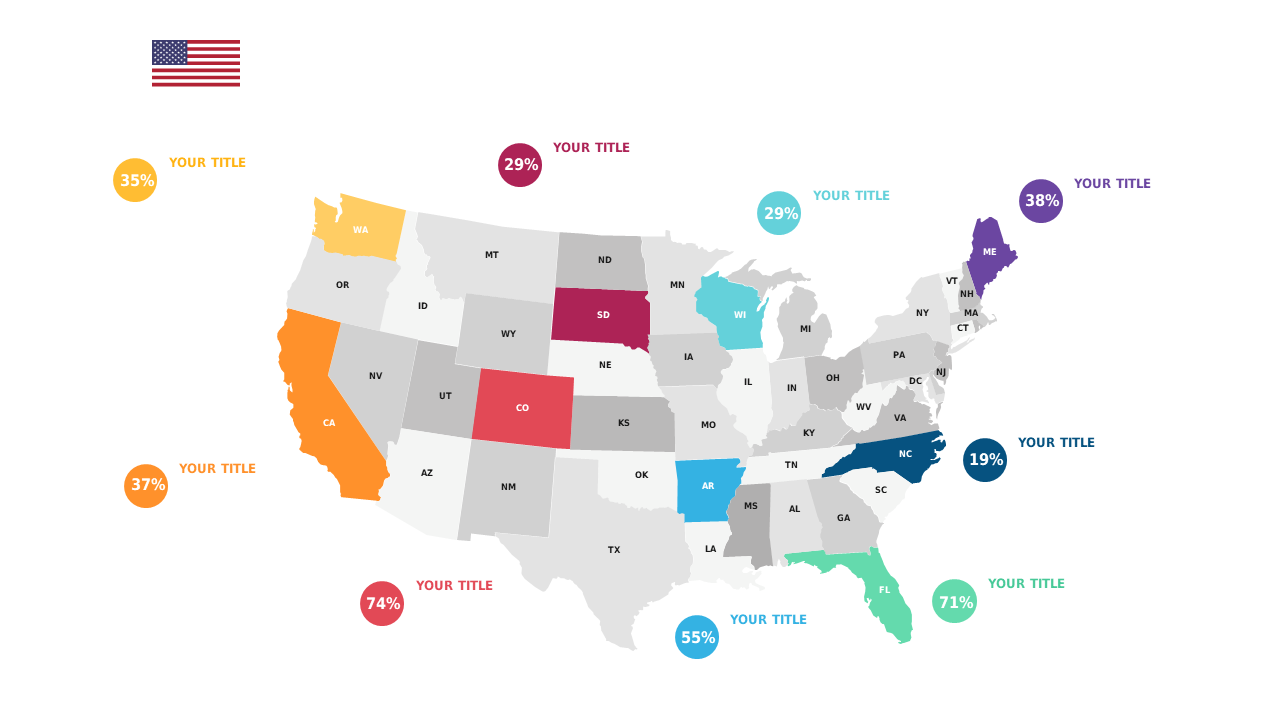
Presenting numerical data in an engaging way can sometimes be a challenge. A visually appealing heat map can not only captivate your audience but also make complex information more accessible.
This U.S. heat map allows you to display percentages across states while ensuring your key points are clearly communicated. You’ll find this slide valuable whether you’re a data analyst presenting market research, a business strategist discussing regional opportunities, or a team leader reviewing performance metrics. Customize the metrics and colors to fit your narrative, making it a fantastic option for any presentation where visual clarity is essential.
This slide is available for just $0.99, making it an affordable addition to your toolkit. It’s ready for instant download and can be easily edited in PowerPoint or Google Slides, allowing you to customize it quickly and efficiently.
$0.99 – Purchase Checkout
Added to cart







