Illustrate Regional Performance with Progress Bars
Product Description
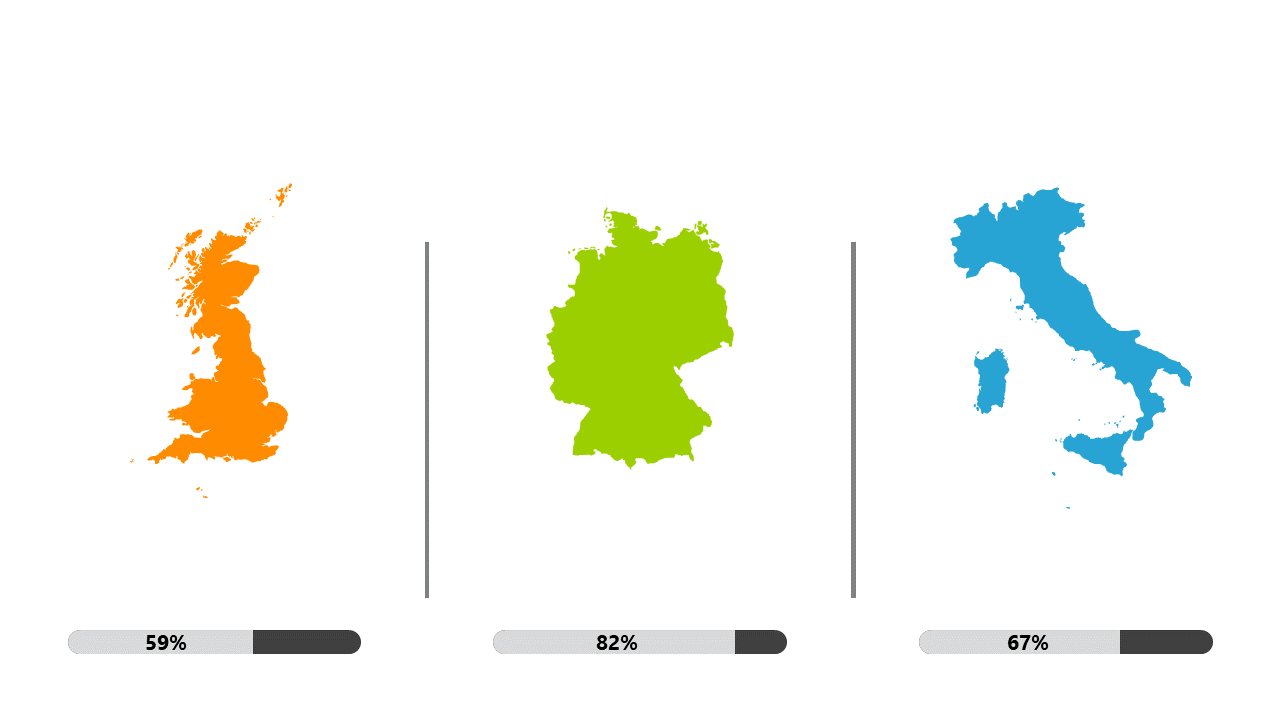
When it comes to comparing performance metrics across different regions, a disorganized presentation can confuse your audience and dilute your message. This slide streamlines that process by combining country maps with percentage progress bars, allowing you to convey your data in a straightforward and engaging manner.
Marketing analysts or regional managers can use this slide during strategy sessions or performance reviews to visualize engagement metrics and growth rates. It’s perfect for presenting regional sales data, market analysis, or campaign performance in a way that resonates with your audience and keeps their attention focused.
Download this slide instantly for only $0.99. It’s ready to edit in PowerPoint and Google Slides, ensuring that your next presentation is polished and professional in no time.
$0.99 – Purchase Checkout
Added to cart







