Compare Country Metrics with Progress Visualization
Product Description
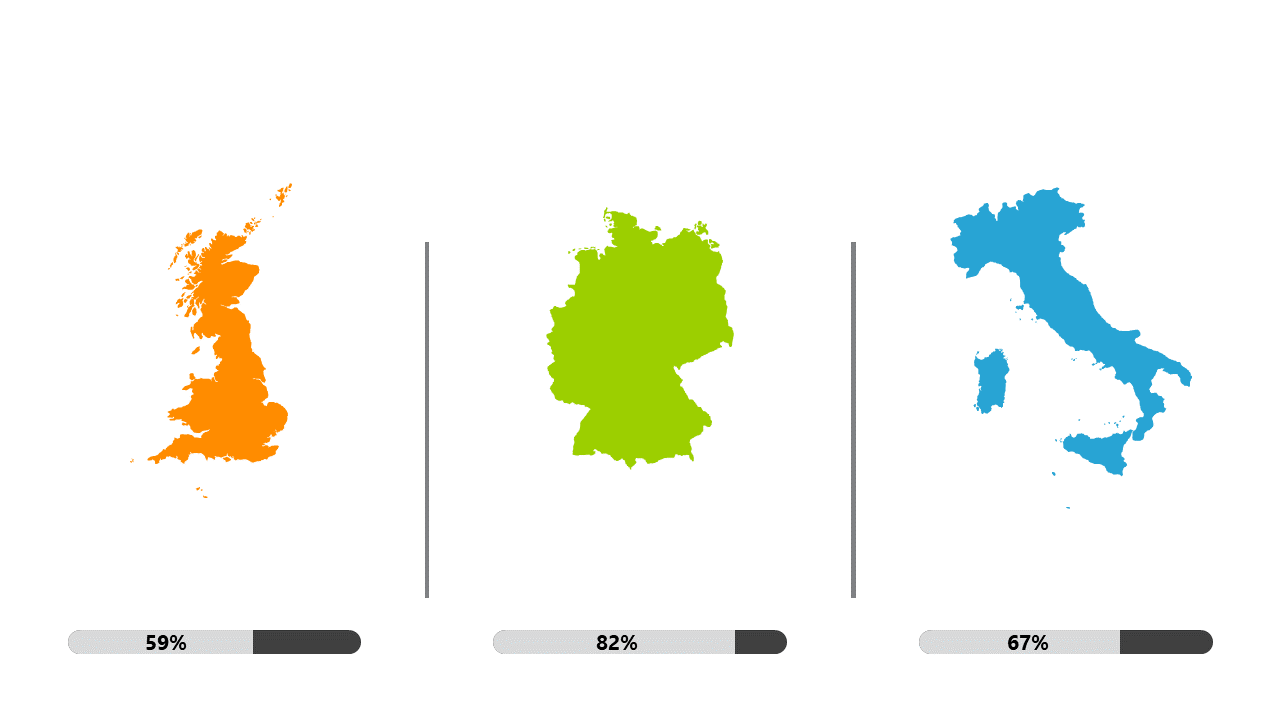
Presenting complex data can be a daunting task, especially when you need your audience to quickly grasp the differences between countries. This slide takes the guesswork out of data comparison by combining visually attractive maps with percentage progress bars, making your insights clear and accessible at a glance.
Data analysts, especially those in international markets, can leverage this slide to effectively compare metrics like GDP, population growth, or internet penetration across different nations. It proves invaluable during quarterly reviews, strategy meetings, or research presentations where conveying performance insights is essential for decision-making.
For just $0.99, you’ll receive an instant download that’s easy to edit in both PowerPoint and Google Slides. Get your data story across with ease and clarity in just a few clicks.
$0.99 – Purchase Checkout
Added to cart







