Engaging Circular Indicators for Data Visualization
Product Description
When it comes to visualizing progress, many find it difficult to strike the right balance between clarity and detail. You want to ensure your audience can easily digest the information without becoming lost in numbers.
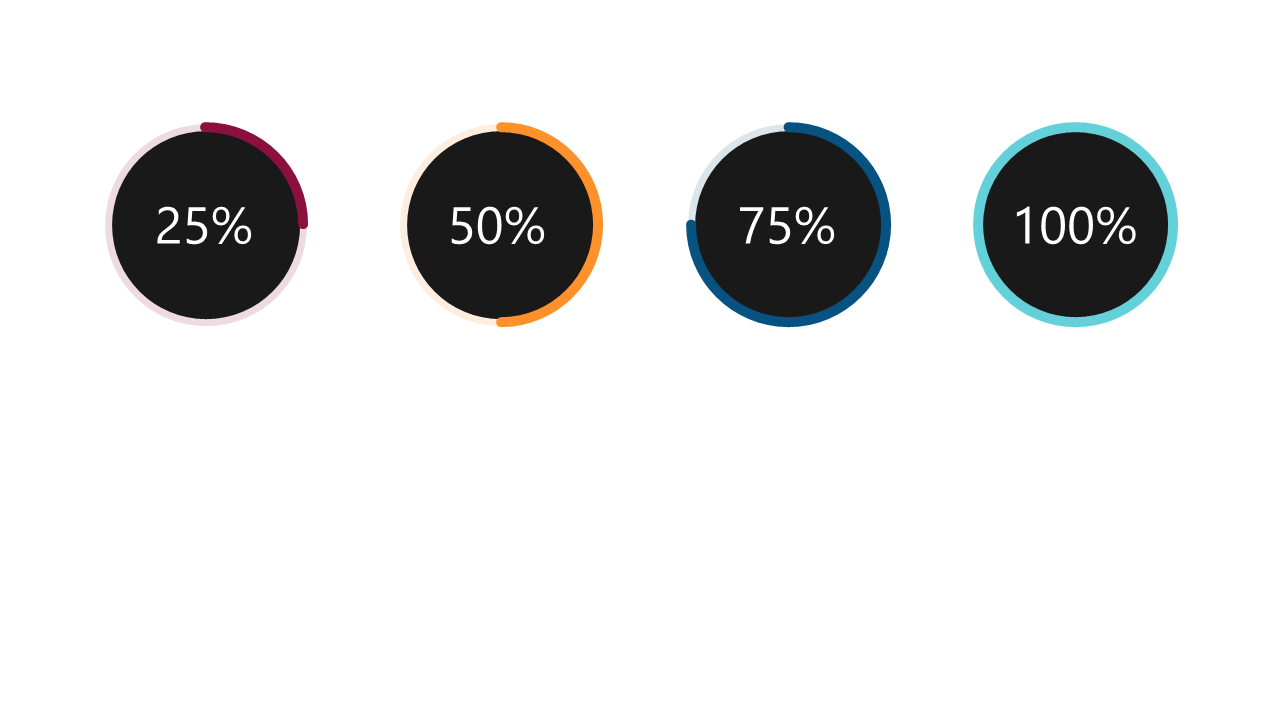
This layout offers four circular progress indicators that simplify data storytelling while keeping it engaging. This slide works well for product managers leading status updates, HR professionals sharing recruitment metrics, or any team needing to report on project phases. Its clear design helps reinforce your message and makes it easier for your audience to see exactly where you stand.
For just $0.99, you can download this slide instantly. It’s fully editable in PowerPoint and Google Slides, giving you the flexibility to tailor it to your specific presentation needs effortlessly.
$0.99 – Purchase Checkout
Added to cart







