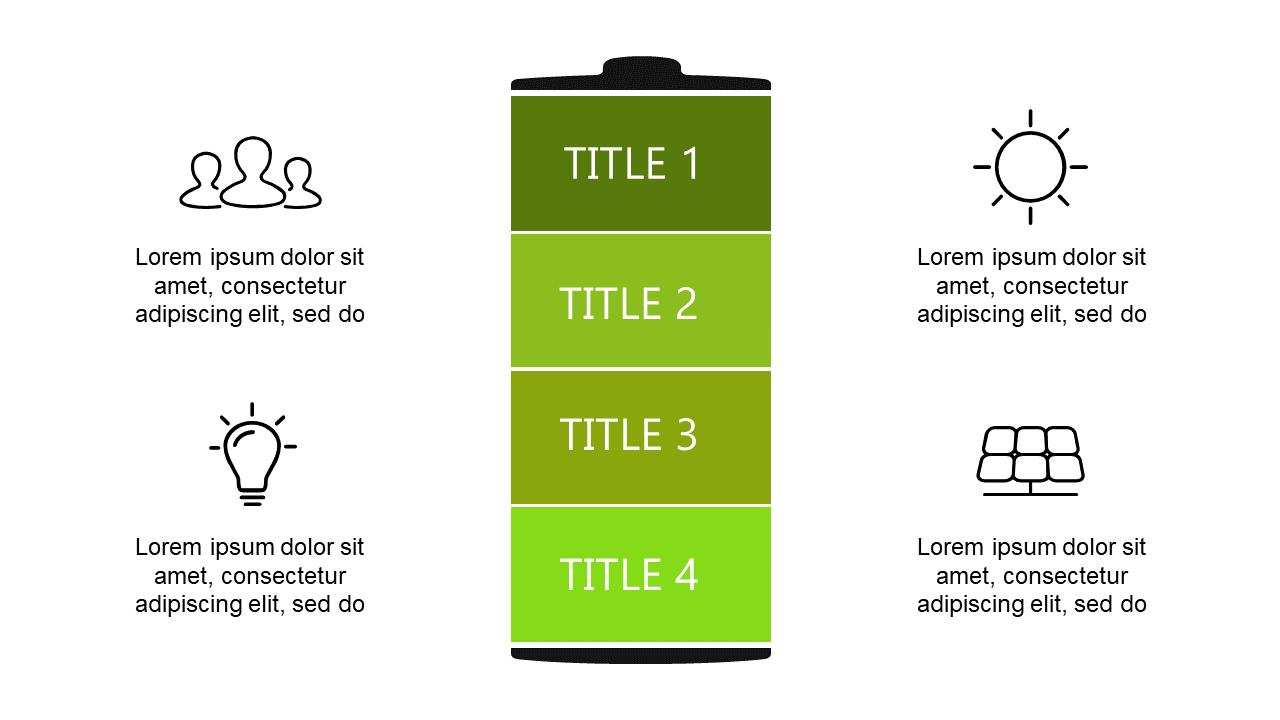
Vertical Battery Chart for Performance Metrics
Product Description
Are your performance metrics getting lost in the sea of data? This vertical battery chart offers a clear and engaging way to present your key performance indicators.
By visually breaking down your metrics and representing progress levels, you can ensure that your data tells the right story. Think about a product manager sharing updates on development milestones or a finance officer presenting quarterly results. This slide is perfect for status meetings or executive presentations, making complex information easier to process and discuss in any industry.
For just $0.99, you can grab this slide and make your data presentations more impactful. It’s ready for instant download and can be edited in PowerPoint and Google Slides, giving you the flexibility to customize it quickly.
$0.99 – Purchase Checkout
Added to cart







