Visualize Performance Metrics with Circular Indicators
Product Description
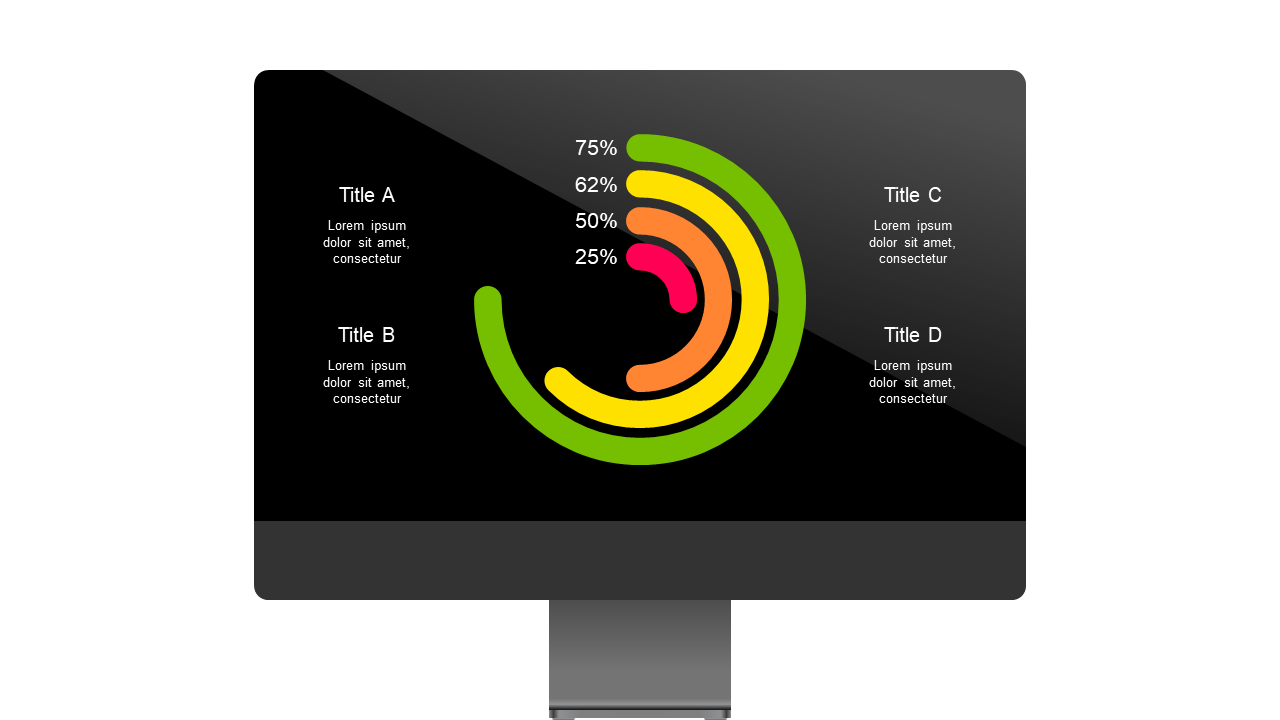
When you’re deep in data analysis, turning raw numbers into digestible insights can be a challenge. There’s a lot of performance information to relay, and you want to ensure it’s understandable at a glance.
Using circular indicators provides a vibrant and engaging way to showcase performance metrics, keeping your presentation dynamic and informative. This slide is ideal for data analysts preparing reports for senior management, marketing teams reviewing campaign success, or finance professionals sharing quarterly outcomes with stakeholders. Any scenario that requires clear communication of performance metrics will benefit from this engaging visual approach, ensuring your audience can easily track key data points.
For only $0.99, this slide is ready for immediate download and is fully customizable in PowerPoint and Google Slides. It’s simple to update with your specific data, allowing you to create an impressive presentation in no time.
$0.99 – Purchase Checkout
Added to cart







