Visual Product Comparison with Split Screen
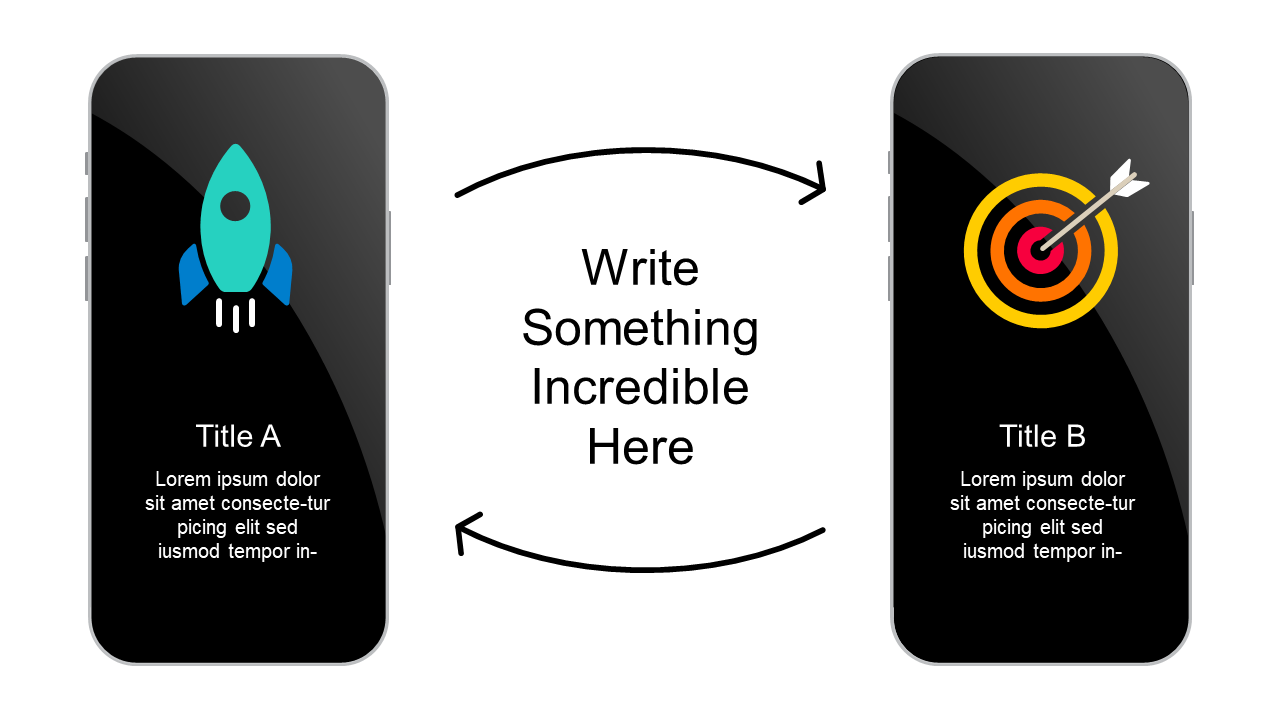
Product Description
Communicating differences between products can often become convoluted, leaving your audience confused rather than informed. This slide’s split-screen design effectively clears that fog by visually separating the two options for easy comparison.
Its simplicity ensures that your message comes through loud and clear. This layout works wonderfully for product managers, sales reps, or consultants in various industries like tech, retail, or service sectors. Whether you’re presenting product features during a sales pitch or conducting a team review, this slide offers a straightforward and impactful way to illustrate comparisons.
Available for just $0.99, this slide is ready for instant download. It’s easily editable in PowerPoint and Google Slides, allowing for quick adjustments to match your branding and content needs, ensuring you can get your presentation ready in no time.
$0.99 – Purchase Checkout
Added to cart