Engage with Colorful Light Bulb Progress Indicators V2
Product Description
Struggling to show progress in a way that grabs attention? It can be tricky to convey percentages without boring your audience.
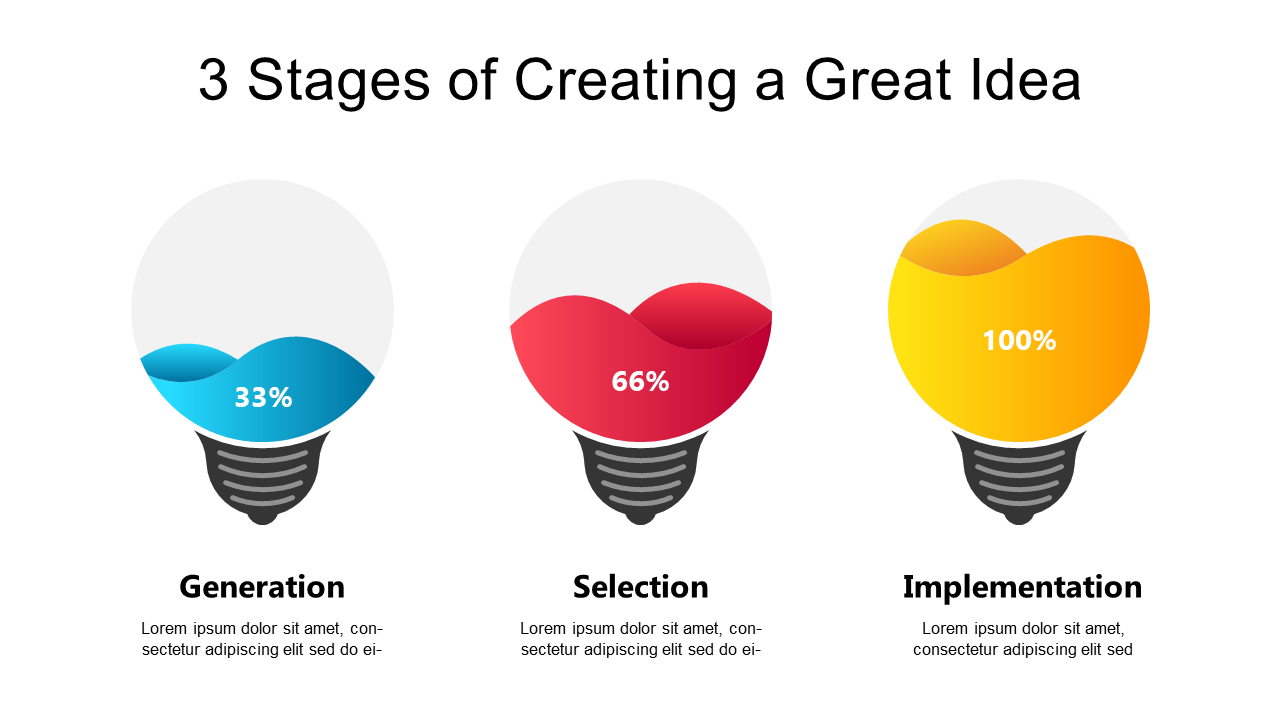
This colorful light bulb progress indicator slide makes it easy to visualize data and keeps your viewers engaged. Whether you’re a marketer presenting campaign results, a project manager updating your team on milestones, or an educator evaluating student progress, this slide fits perfectly in your toolkit. Use it in meetings, reports, or even classroom presentations to highlight achievements effectively.
For just $0.99, you get an instant download that’s customizable in both PowerPoint and Google Slides. Editing the colors and percentage texts is a breeze, allowing you to tailor it to your specific needs in minutes.
$0.99 – Purchase Checkout
Added to cart







