Explore COVID-19 Vaccination Rates in Brazil by City
Product Description
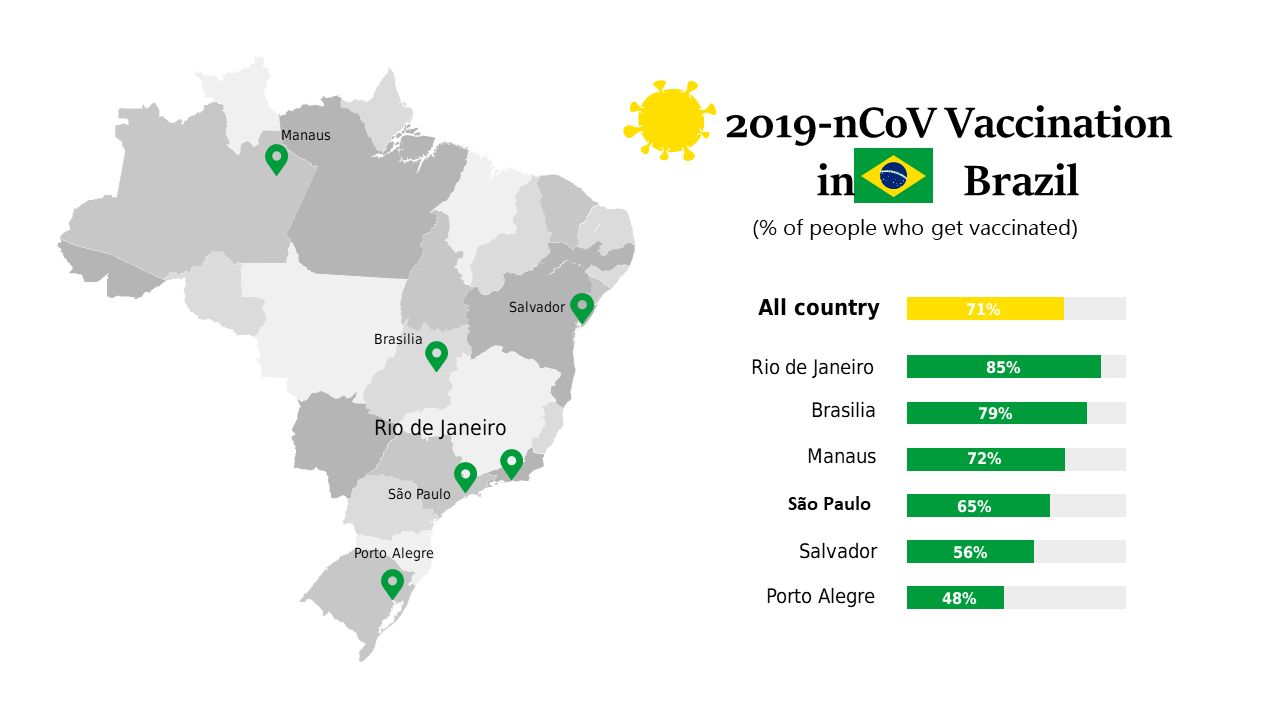
When you need to explain complex vaccination data across cities, clarity is key. This slide provides an engaging map of Brazil that highlights COVID-19 vaccination rates, simplifying the communication of this critical information.
Public health officials, statisticians, and educators can use this slide during conferences, community meetings, or educational sessions to showcase vaccination efforts and their implications across various locales. It’s perfect for those who need to present regional data in an understandable way.
Available for just $0.99, you can download this slide instantly and customize it to fit your needs in both PowerPoint and Google Slides. Get your visuals ready quickly and efficiently.
$0.99 – Purchase Checkout
Added to cart







