Visualize COVID-19 Vaccination Rates in France V2
Product Description
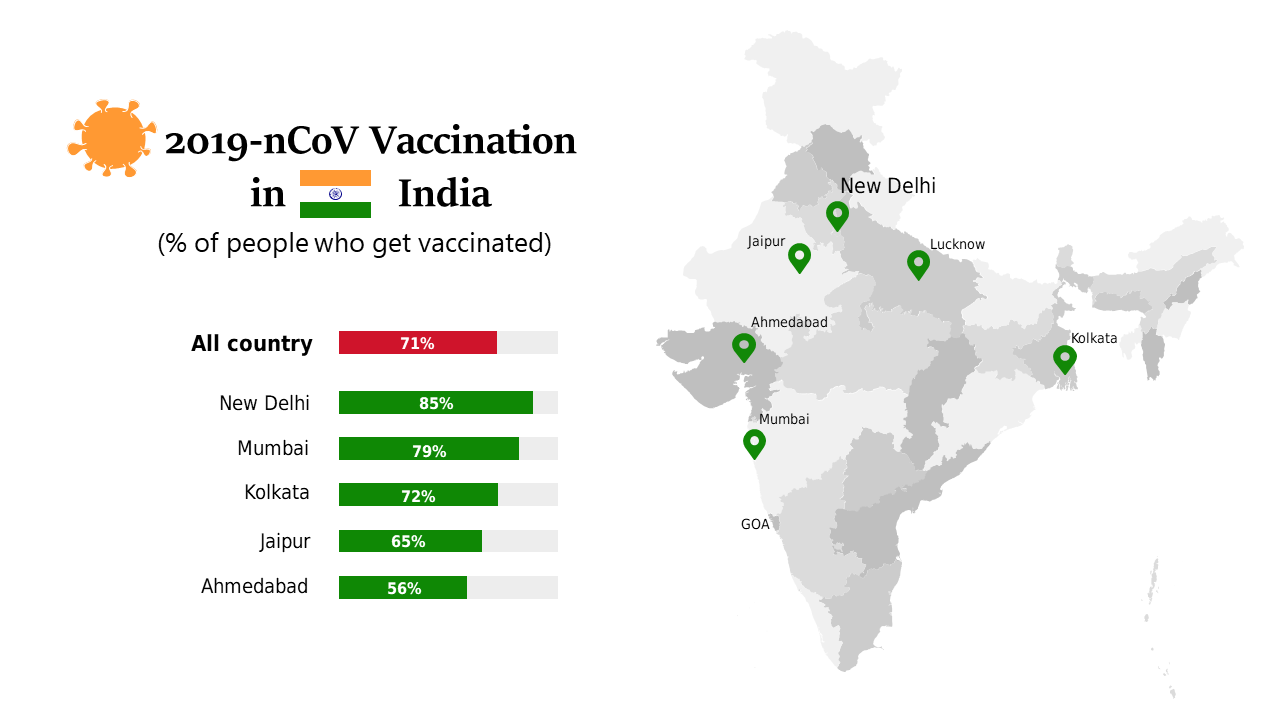
Understanding COVID-19 vaccination rates is crucial for making informed decisions, especially when public health directly impacts economic stability. This slide helps you visualize vaccination data across France, making it easier to grasp complex statistics and communicate them effectively.
Finance professionals, analysts, and public health officials will benefit from this clear map representation during presentations, strategy meetings, or when drafting reports on the effects of vaccination on economic performance. It’s perfect for any situation where you need to discuss health trends and their financial implications.
For just $0.99, you can instantly download this slide, which is fully editable in both PowerPoint and Google Slides. Get your data visualized and ready to present in minutes.
$0.99 – Purchase Checkout
Added to cart







