Present Global COVID-19 Vaccination Rates Map
Product Description
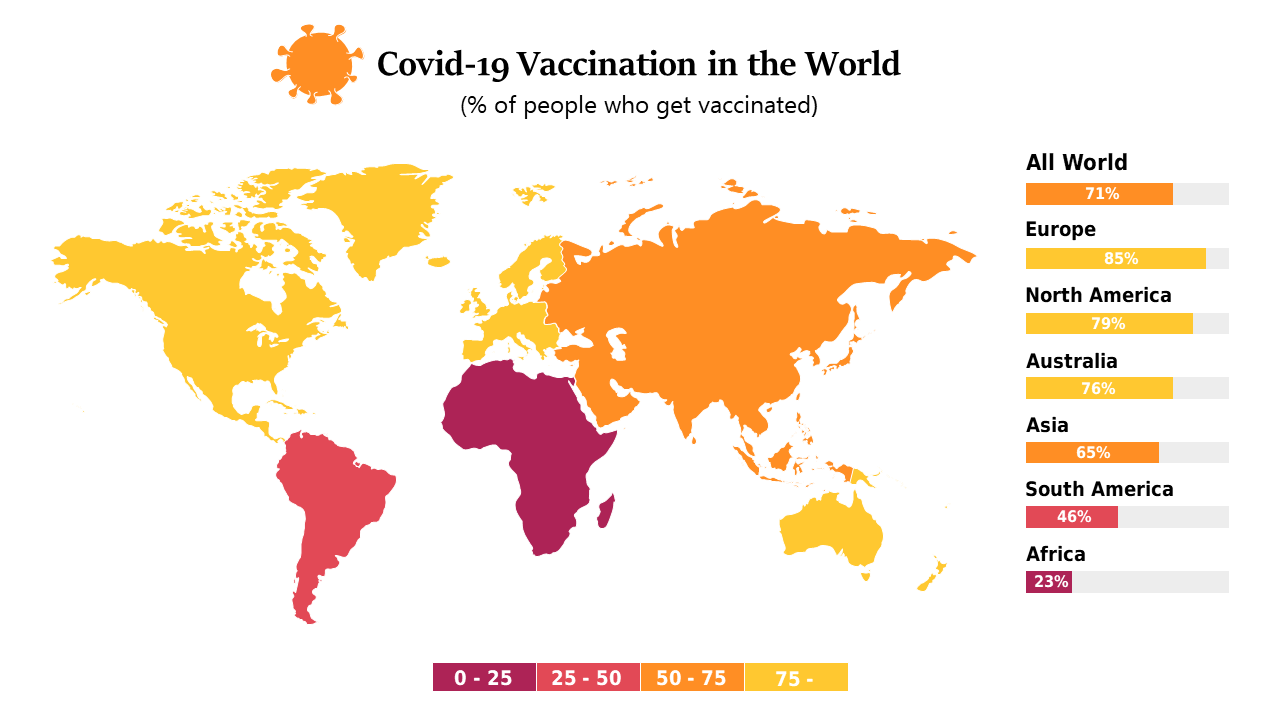
Presenting data on global health trends can often lead to confusion without the right visuals. A standard chart may not effectively communicate the disparities in COVID-19 vaccination rates across different regions, but this color-coded world map highlights these differences clearly.
Public health professionals, researchers, and educators can use this slide in reports, meetings, or classroom presentations to convey vital information in a straightforward way. Whether you’re analyzing vaccination drives or discussing global health policies, this visual tool helps you deliver your message effectively.
At only $0.99, this map is available for instant download and is simple to edit in PowerPoint and Google Slides. Customize the colors and data representations to match your specific needs and deliver impactful insights within moments.
$0.99 – Purchase Checkout
Added to cart







