Public Opinion Metrics Comparison for COVID-19
Product Description
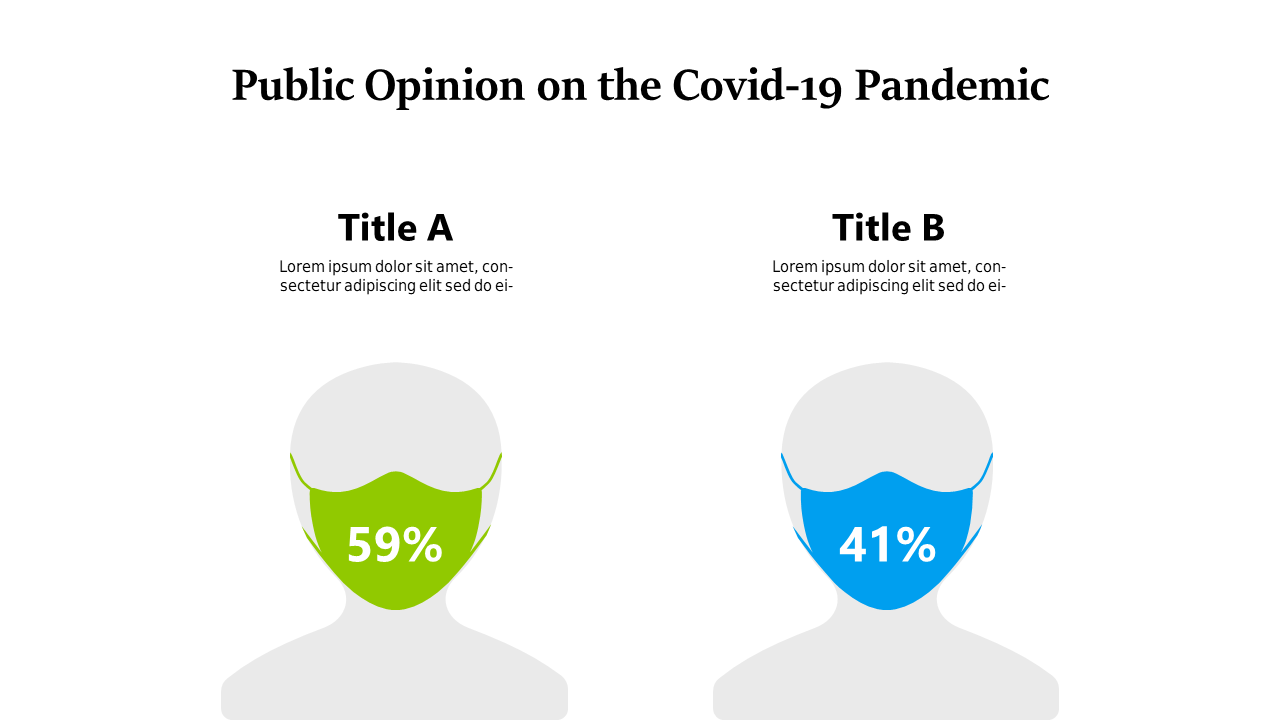
Understanding public opinion during a crisis like COVID-19 is crucial, but presenting that data can be tricky. This slide simplifies the process of comparing metrics, allowing you to visually communicate survey results effectively.
It enables you to present complex information in a straightforward, side-by-side format that resonates with your audience. This layout is ideal for business professionals, marketers, and researchers focusing on public sentiment analysis. You can use it in reports, conference presentations, or even during strategic planning sessions to illustrate divergent opinions on health responses or community guidelines.
For just $0.99, you can easily download this slide and customize it for your specific data. It’s compatible with both PowerPoint and Google Slides, so you can edit it quickly and have your materials ready to present in moments.
$0.99 – Purchase Checkout
Added to cart







