Compare Public Opinion Metrics on COVID-19
Product Description
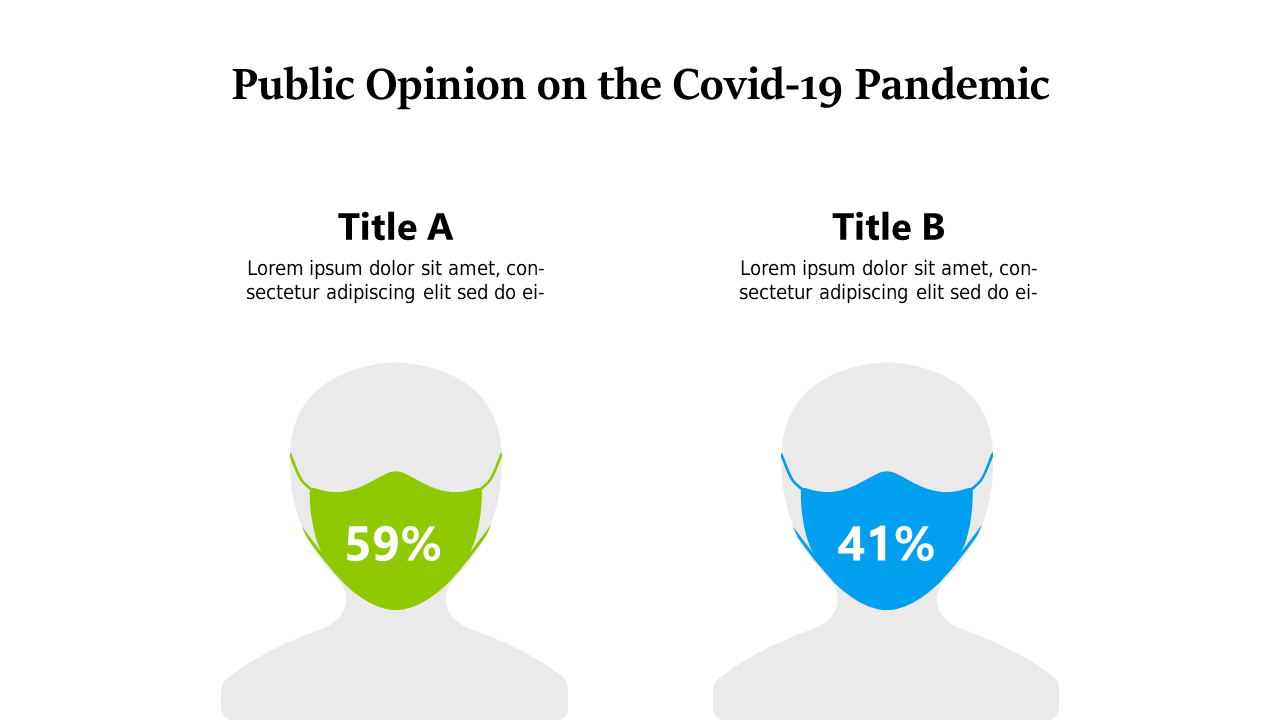
When presenting survey results or statistics, clarity is key, especially regarding sensitive topics like COVID-19. This side-by-side comparison layout makes it simple to showcase differing public opinions on the pandemic.
It helps you highlight contrasting viewpoints in a way that’s easy for your audience to understand. Business professionals, marketers, and researchers will find this slide perfect for meetings, reports, or presentations that require data visualization. Use it to display public sentiment analysis or survey findings that underline different perspectives on health mandates, vaccinations, or safety measures.
At only $0.99, this slide is an instant download that will fit seamlessly into your workflow. It’s designed to be easily editable in PowerPoint and Google Slides, allowing you to customize every aspect and have it ready for your audience in no time.
$0.99 – Purchase Checkout
Added to cart







