Showcase Brazil’s Health Metrics with Map and Icons
Product Description
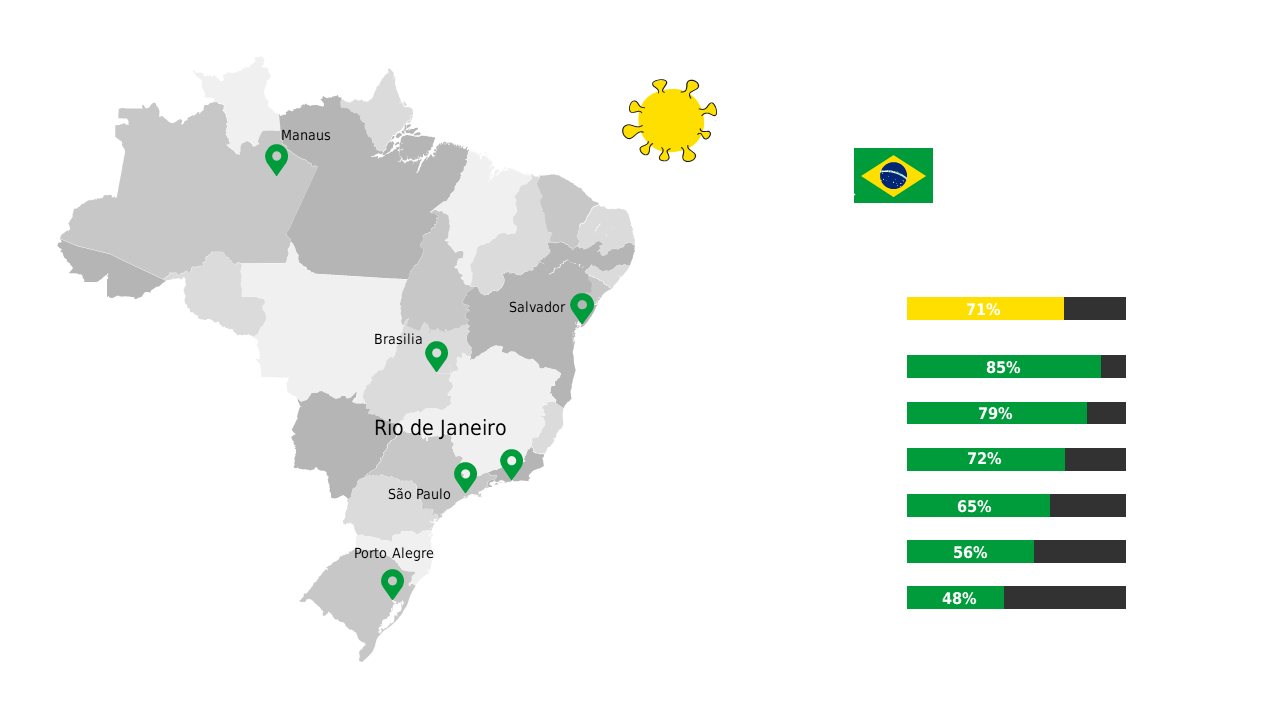
Effectively showcasing health metrics can be tricky, especially when the data spans across different regions like Brazil. This slide streamlines that process with an engaging layout that features a map and icons alongside graphical representations of health statistics.
Ideal for health professionals and researchers, this slide is perfect for presenting at health conferences, academic lectures, or community health meetings. It allows you to share crucial information in a visually compelling way, which can help foster understanding and discussion among various audiences.
At just $0.99, this slide is available for instant download and is easily customizable in PowerPoint and Google Slides. You can tweak the map, icons, and charts to fit your specific context, ensuring your presentation is both informative and visually appealing.
$0.99 – Purchase Checkout
Added to cart







