Visualize COVID-19 Statistics by Region in France
Product Description
Presenting complex COVID-19 statistics can be overwhelming, especially when your audience needs clear insights to make informed decisions. It’s crucial to showcase data in a way that’s both visually appealing and easy to understand, so you don’t lose your audience in a sea of numbers.
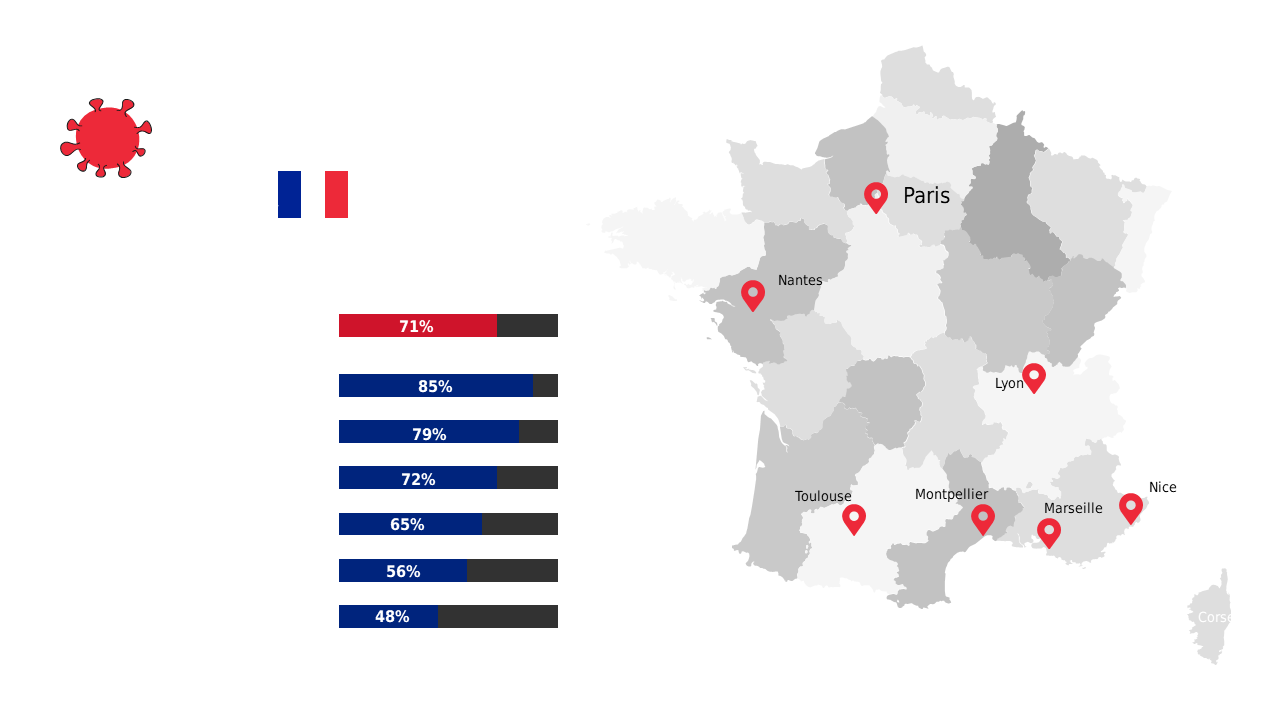
This slide solves that problem by combining a detailed map of France with a straightforward bar graph to illustrate regional statistics. This layout is perfect for public health officials analyzing trends in different regions or data analysts preparing reports for conferences and meetings. Whether you’re communicating with government agencies, health organizations, or community groups, having a visually organized presentation can help drive your message home and engage your audience effectively.
For just $0.99, you can download this slide, which is fully editable in PowerPoint and Google Slides. Customize the map and data values to fit your specific needs and be ready to present in minutes.
$0.99 – Purchase Checkout
Added to cart







