Communicate COVID-19 Impact in the US Clearly
Product Description
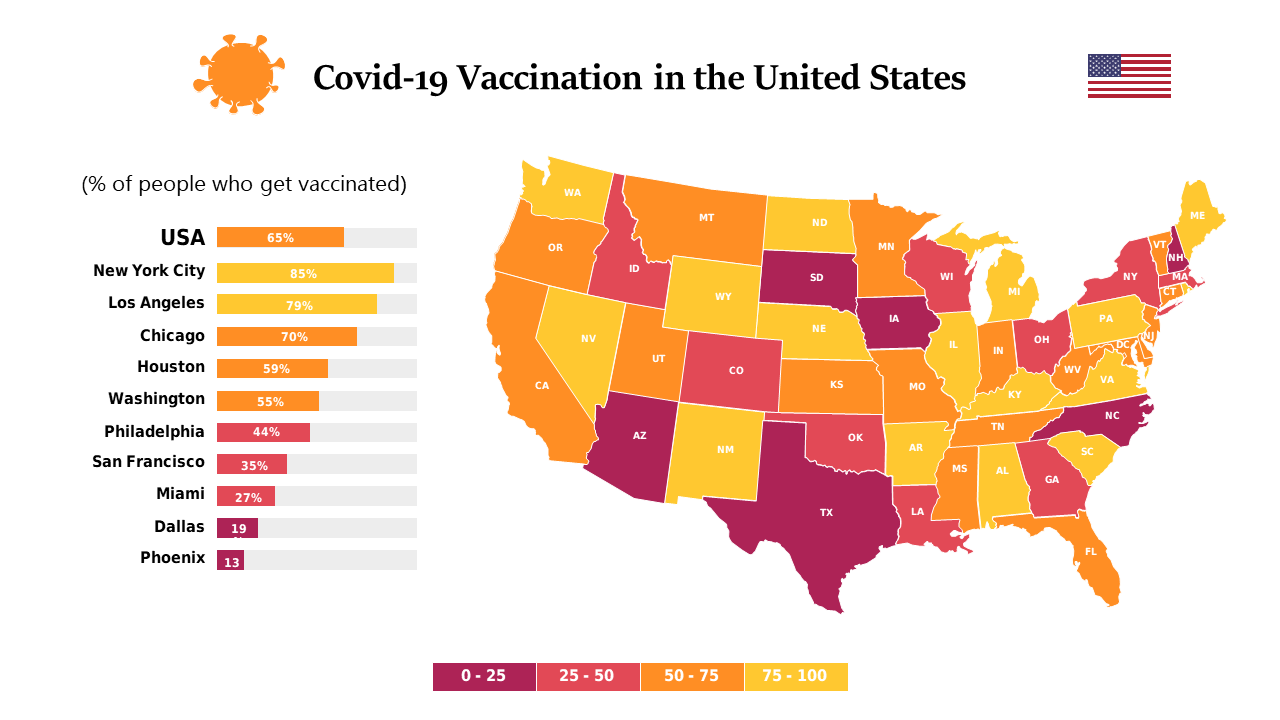
Communicating the impact of COVID-19 across the US can often feel overwhelming, especially when trying to make sense of extensive data. You need a way to present this information clearly and effectively, enabling your audience to grasp the situation quickly and make informed decisions. A heat map paired with a data chart does just that, ensuring that your message is both intuitive and visually appealing.
Public health officials, data analysts, and policymakers will find this slide particularly useful during briefings, community meetings, or strategy sessions. Whether you’re discussing resource allocation, vaccination strategies, or public health messaging, this layout allows you to visualize the trends and challenges across various states effectively.
Its clear state color coding makes it simple for your audience to understand the varying levels of impact at a glance. For just $0.99, this slide is ready to download instantly and is fully editable in PowerPoint and Google Slides. You can easily adjust the data and colors to fit your presentation needs, allowing you to create a compelling narrative in minutes.
$0.99 – Purchase Checkout
Added to cart







