Present COVID-19 Data Trends in the US Effectively
Product Description
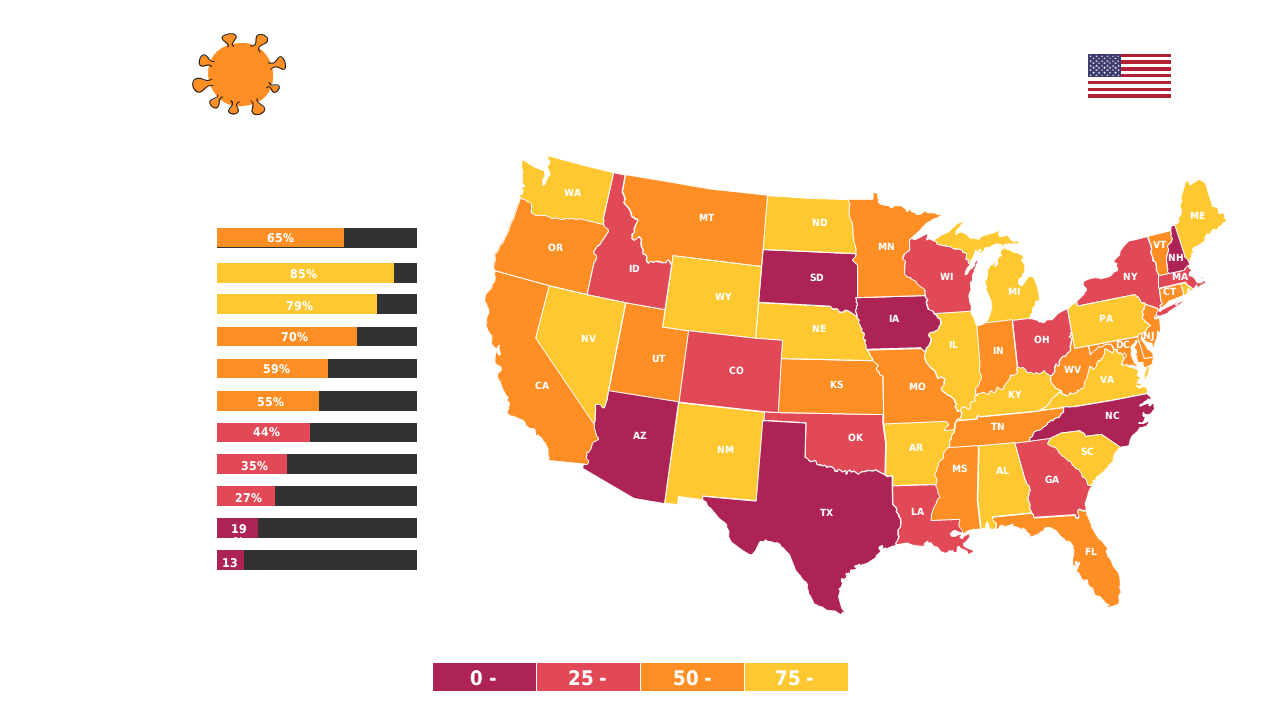
Navigating the presentation of COVID-19 trends can be challenging, particularly when you need to illustrate a lot of data in a compelling way. This heat map of the United States makes it simple to visualize impact levels by state, turning complex data into easy-to-understand visuals that capture your audience’s attention.
Healthcare strategists, local government officials, and education administrators can effectively use this slide in community meetings, policy discussions, or educational settings. The visual clarity helps ensure that your audience walks away with a solid understanding of the current landscape.
For only $0.99, this slide is available for instant download and is easily editable. You can tweak it in either PowerPoint or Google Slides, making it a breeze to adapt for your specific presentation needs.
$0.99 – Purchase Checkout
Added to cart







