Highlight COVID-19 Data in Australia with Maps
Product Description
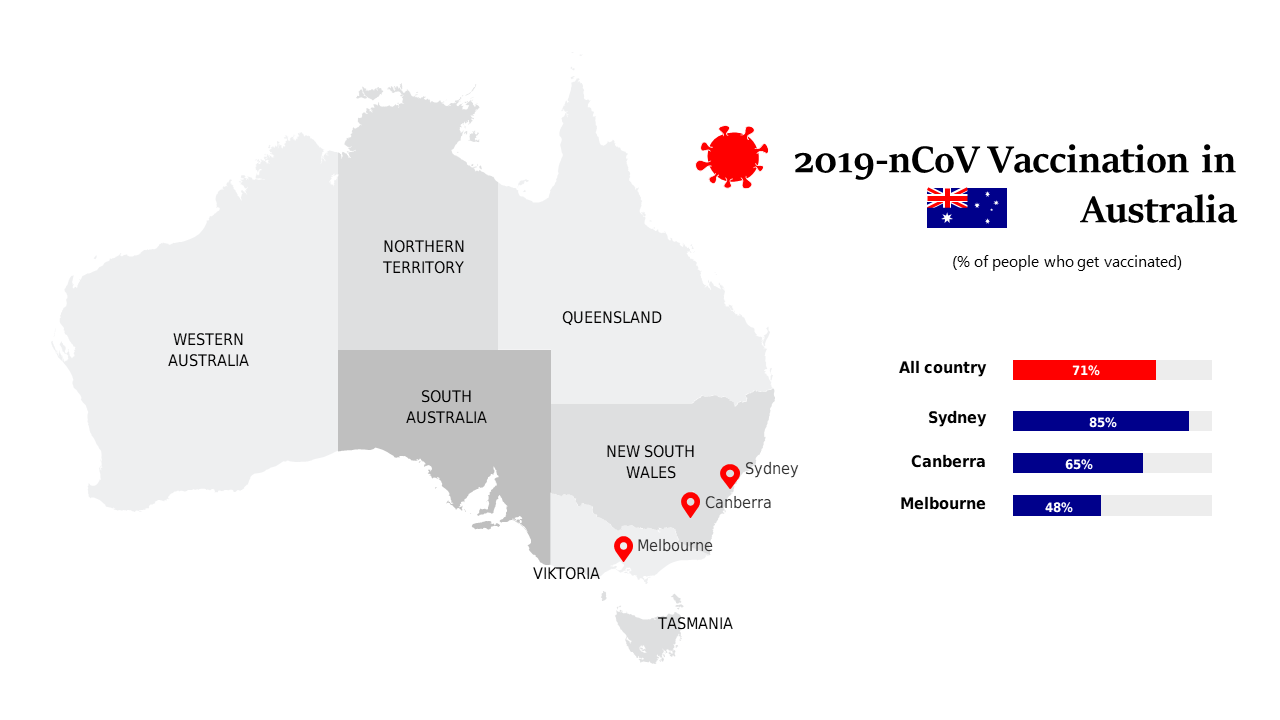
Communicating COVID-19 trends effectively can be tricky, especially when trying to engage an audience with varying levels of understanding. This slide offers a clear and visually appealing map of Australia that highlights regional COVID-19 data, making it simpler for your audience to comprehend the ongoing situation.
Public health officials, educators, and community leaders can use this slide during town hall meetings, school presentations, or public health discussions. By showcasing data in a straightforward manner, you can ensure that everyone in the room understands the critical information being discussed.
Grab this slide for just $0.99, and enjoy the convenience of instant downloading. It’s fully editable in both PowerPoint and Google Slides, allowing you to tailor it to fit your specific needs quickly.
$0.99 – Purchase Checkout
Added to cart







