Communicate COVID-19 Data for Australia Effectively
Product Description
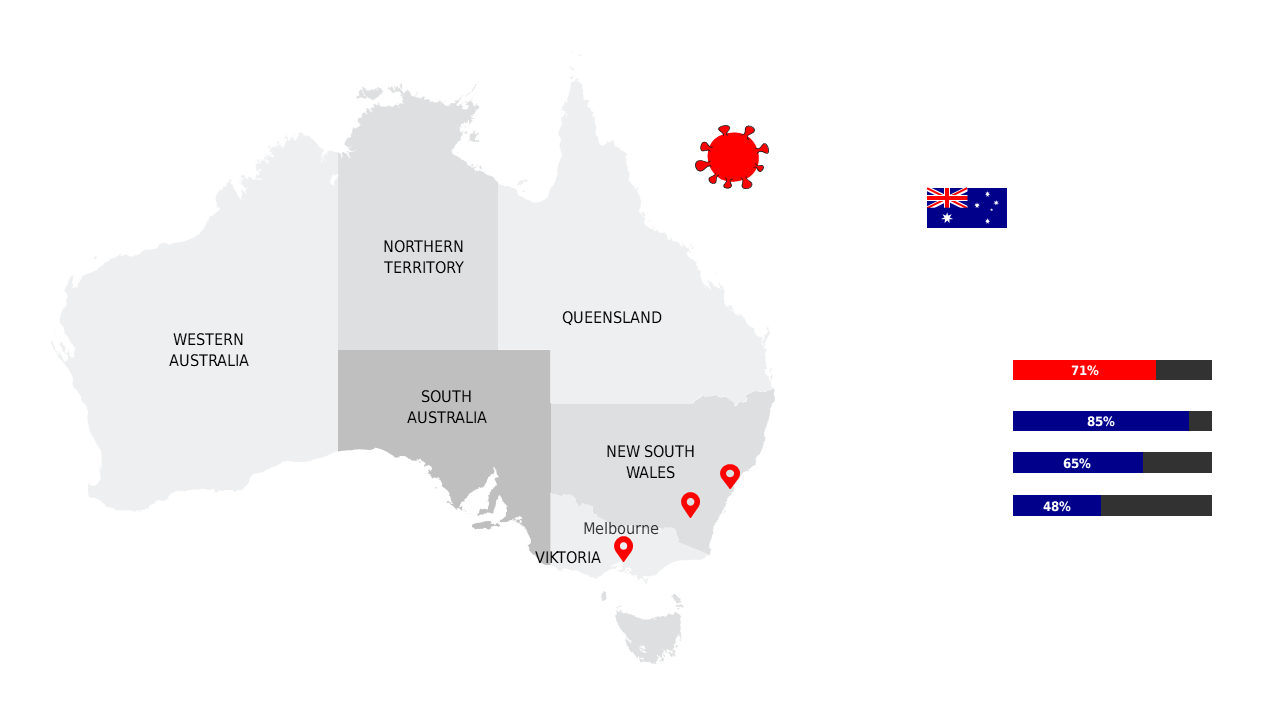
When discussing COVID-19 data for Australia, it’s essential to present your findings in a way that is both clear and impactful. This slide enables you to convey critical regional statistics through color-coded visuals, making complex data easier to comprehend for your audience.
Health professionals, policymakers, and educators will find this layout useful during briefings or public health presentations where clear communication is vital. It allows you to present the latest trends and data points in an intuitive manner, ensuring that your message resonates.
Available for just $0.99, this slide can be downloaded instantly and adapted for your specific needs. It is fully editable in both PowerPoint and Google Slides, giving you the flexibility to modify each element to suit your presentation style.
$0.99 – Purchase Checkout
Added to cart







