Showcase African Metrics with Geographic Visualization
Product Description
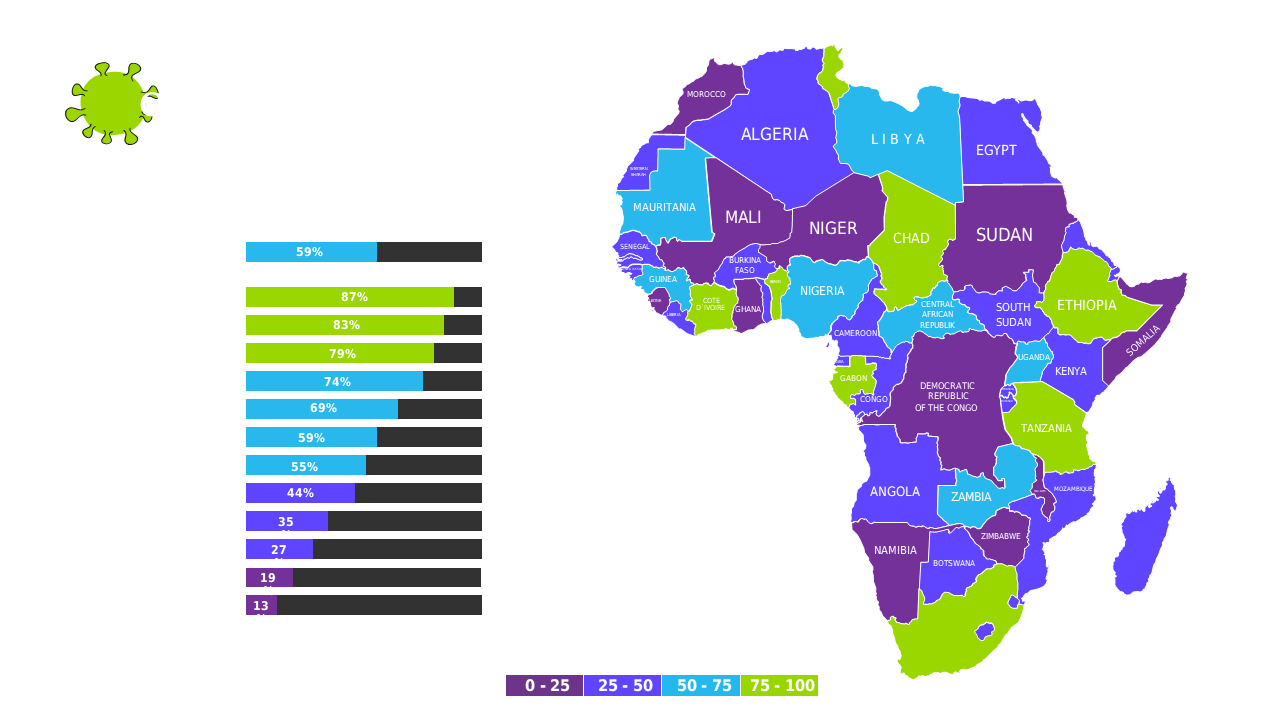
Communicating complex data about African markets can pose significant challenges, especially when trying to keep your audience engaged. This slide resolves that issue by combining a color-coded map and a bar chart, making your regional performance metrics accessible and visually appealing.
This layout is particularly suited for data analysts and business professionals presenting at international conferences or during stakeholder meetings. If you’re working in sectors like finance or development, this slide will help you effectively share crucial insights.
For just $0.99, you can download this slide and quickly make it your own by adjusting the design. It’s fully editable in PowerPoint and Google Slides, so you can dive right into customizing your data presentation.
$0.99 – Purchase Checkout
Added to cart







