Present South America Statistics with Map and Graph
Product Description
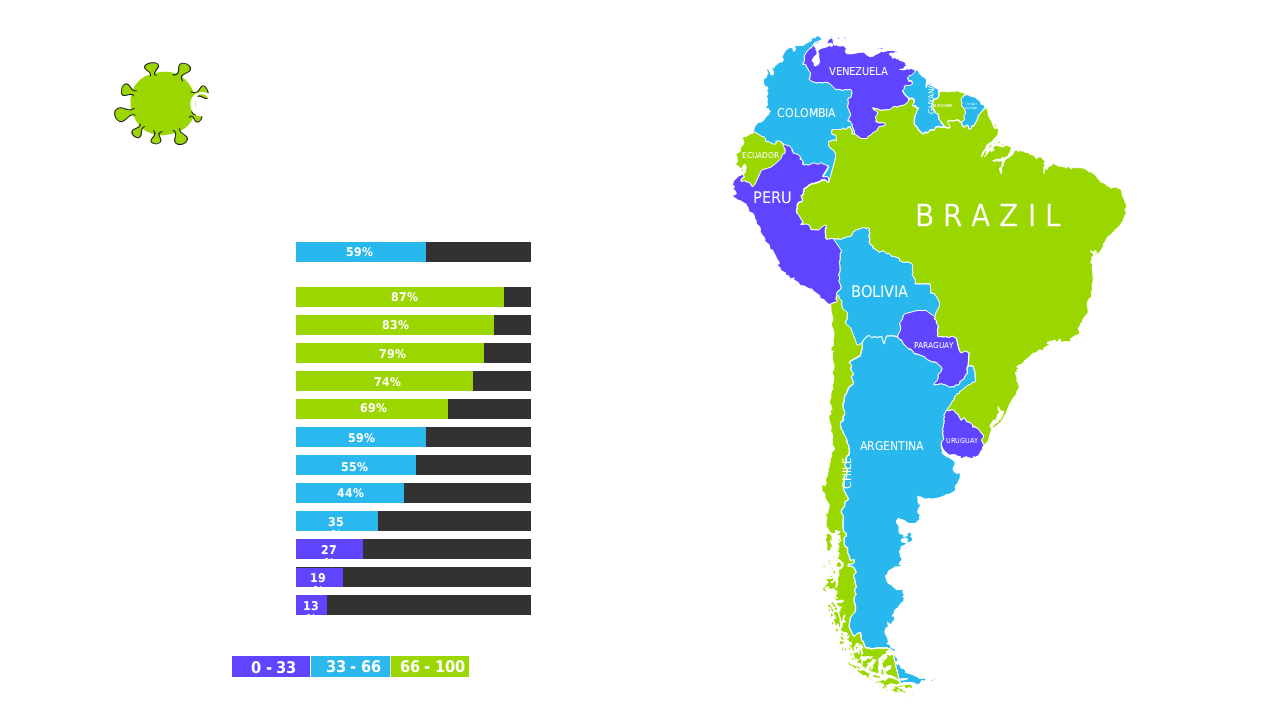
Getting your message across when discussing South America’s statistics can be a daunting task, particularly when relying solely on text. This slide offers an engaging visual format with a color-coded map and a vertical bar graph that make it simple to compare data at a glance.
Use this slide for your presentations as a data analyst or researcher, particularly when discussing economic trends or demographic data in meetings with your team or at industry conferences. It’s an excellent choice for anyone needing to illustrate important statistics in a clear and compelling way.
At only $0.99, this slide is ready for download and can be tailored to your specifics in no time. You’ll find it easy to edit in both PowerPoint and Google Slides, ensuring you can present your findings with confidence and clarity.
$0.99 – Purchase Checkout
Added to cart







