Epidemic Impact Mapping for Europe in Google Slides
Product Description
Presenting the impact of an epidemic requires clarity and engagement to ensure your audience stays informed and focused. You need to communicate complex information in a straightforward way that is easily digestible.
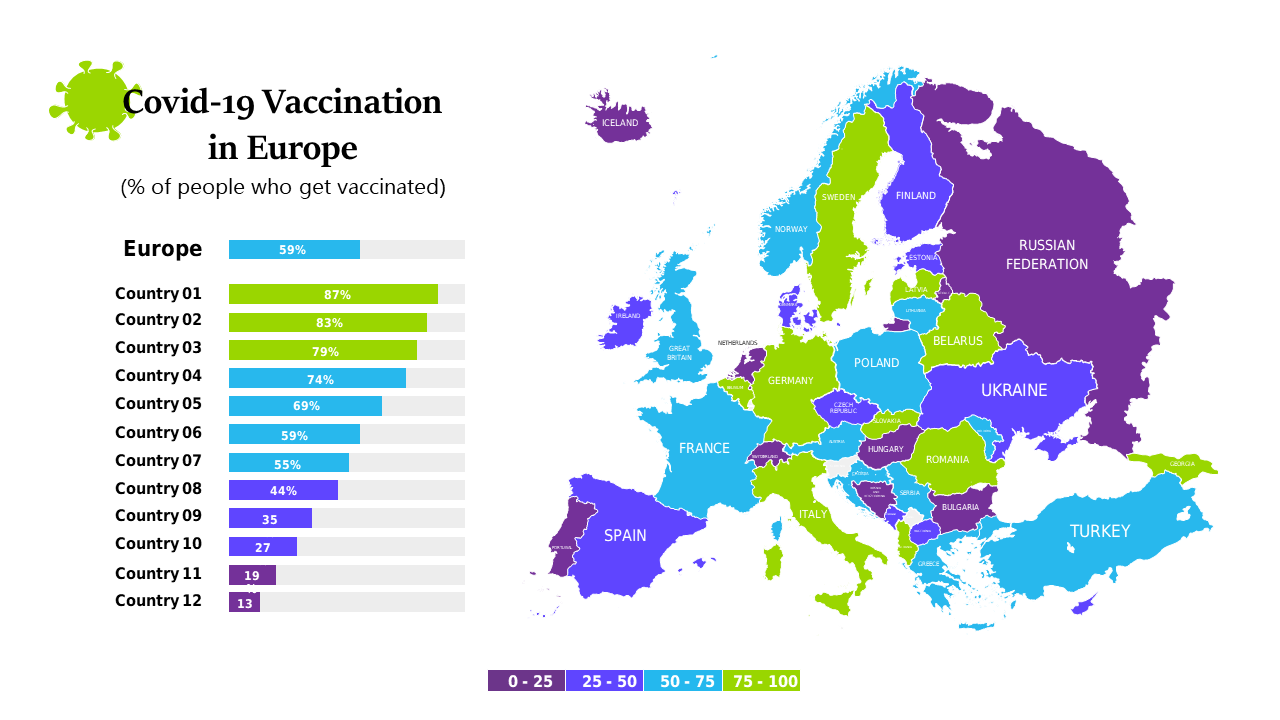
This slide fits perfectly for health professionals, researchers, and policy advisors who need to present data during briefings or discussions on epidemic responses across Europe. The vibrant map and accompanying charts make it easier for your audience to grasp critical insights as you navigate through your findings.
For just $0.99, you can instantly download this slide, which is fully editable in both PowerPoint and Google Slides. Get it ready for your presentation within minutes by customizing it with your specific data.
$0.99 – Purchase Checkout
Added to cart







