Visualize Global COVID-19 Impact with Heat Map
Product Description
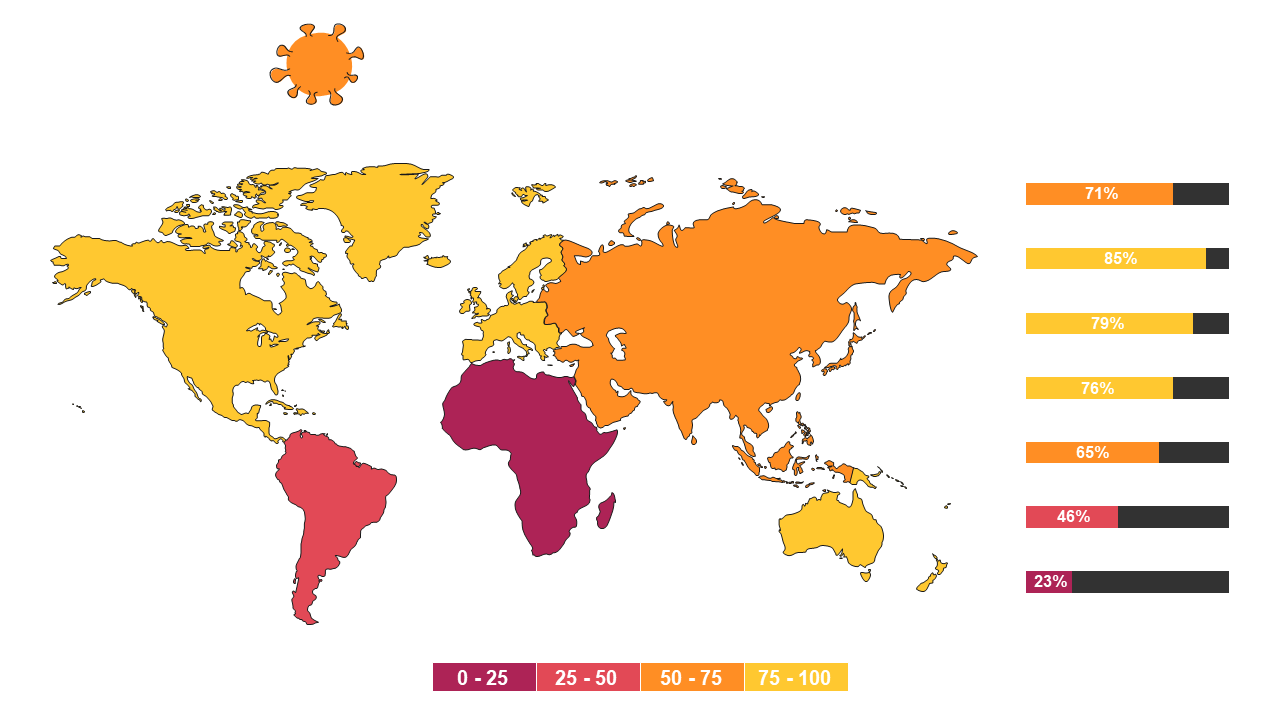
Understanding the global impact of COVID-19 is essential, yet presenting this data in a visually engaging way can be tough. This heat map layout simplifies the complexities of the pandemic by visually conveying the severity of its impact around the world.
Health organizations analyzing data, policymakers discussing interventions, or researchers presenting findings will find this template invaluable. It serves as an effective visual aid for reports, briefings, and discussions on global health trends.
At just $0.99, this slide is ready for instant download and can be easily edited in PowerPoint and Google Slides. Customize it to fit your requirements and make your presentation stand out in just minutes.
$0.99 – Purchase Checkout
Added to cart







