Visualize Audience Segmentation with Percentages
Product Description
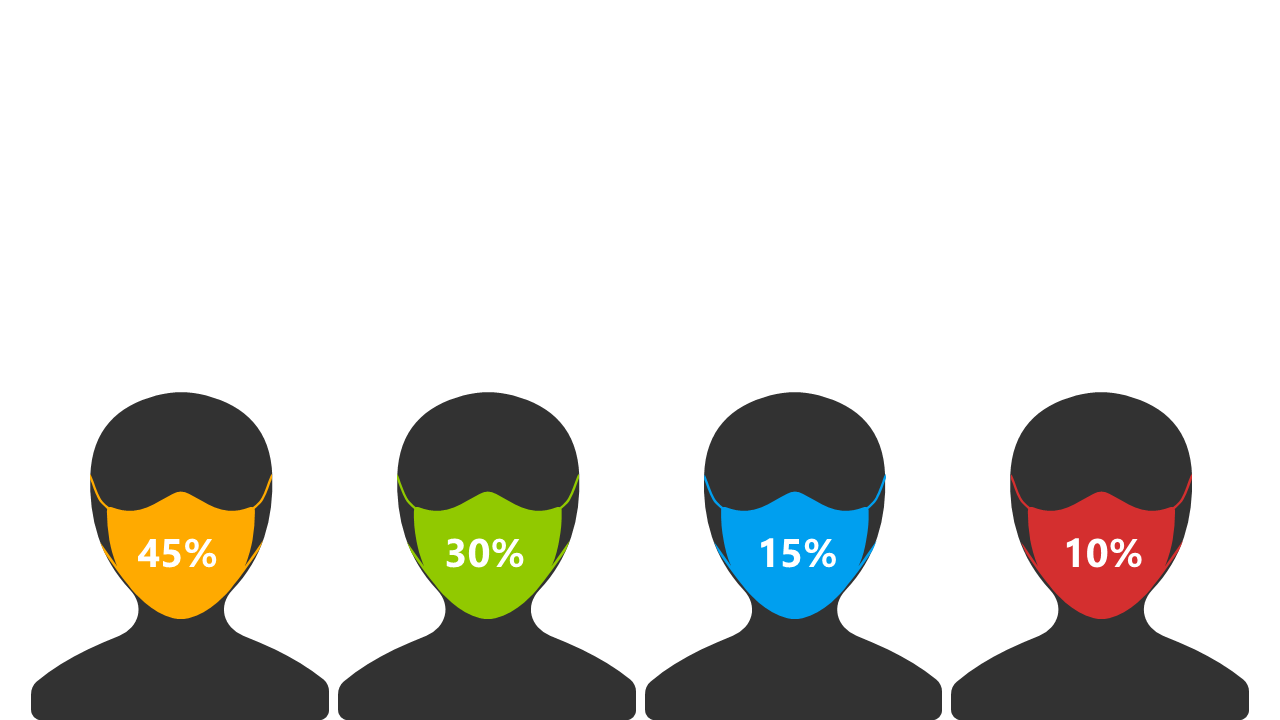
Making sense of audience segmentation can be a challenge, especially when you want to visually capture the diversity inherent in your market. Communicating demographics effectively is essential for any marketing strategy, and this slide provides a vibrant and clear way to show those distinctions.
Marketers, business analysts, and brand managers can utilize this slide in presentations that require data on market share or customer segments. Picture a marketing lead presenting findings from a recent campaign or a business analyst discussing target demographics at a quarterly review — this layout makes it easy to share insightful data.
For only $0.99, you’ll gain instant access to this slide, which you can quickly customize in PowerPoint or Google Slides. It’s designed for simplicity so you can adjust colors and texts effortlessly, making your data stand out in minutes.
$0.99 – Purchase Checkout
Added to cart







