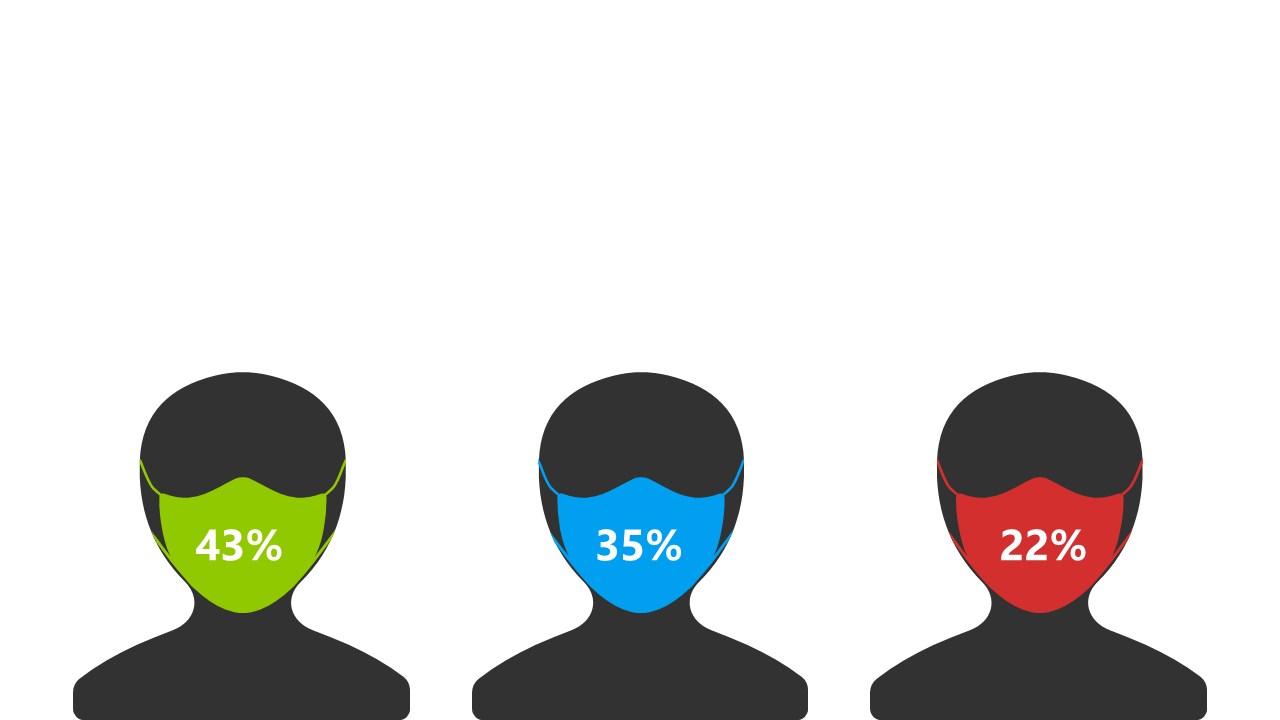
Illustrate Survey Results with Masked Figures
Product Description
Presenting survey results can feel overwhelming when trying to convey important statistics without losing your audience. You need a clear and engaging way to make those numbers resonate, especially when discussing sensitive topics such as health or public opinion.
This slide helps transform abstract data into relatable visuals that capture attention. Perfect for market researchers, public health officials, or compliance officers, this layout is designed for meetings where clear communication of survey findings is essential. Imagine a product manager needing to present health survey data to the executive team or a policy analyst illustrating public opinion trends to stakeholders — this slide has you covered.
At just $0.99, you can download this slide instantly and customize it to fit your needs. It’s ready for quick edits in both PowerPoint and Google Slides, allowing you to personalize colors and figures in no time.
$0.99 – Purchase Checkout
Added to cart







