Compare Survey Results with Icon Percentages
Product Description
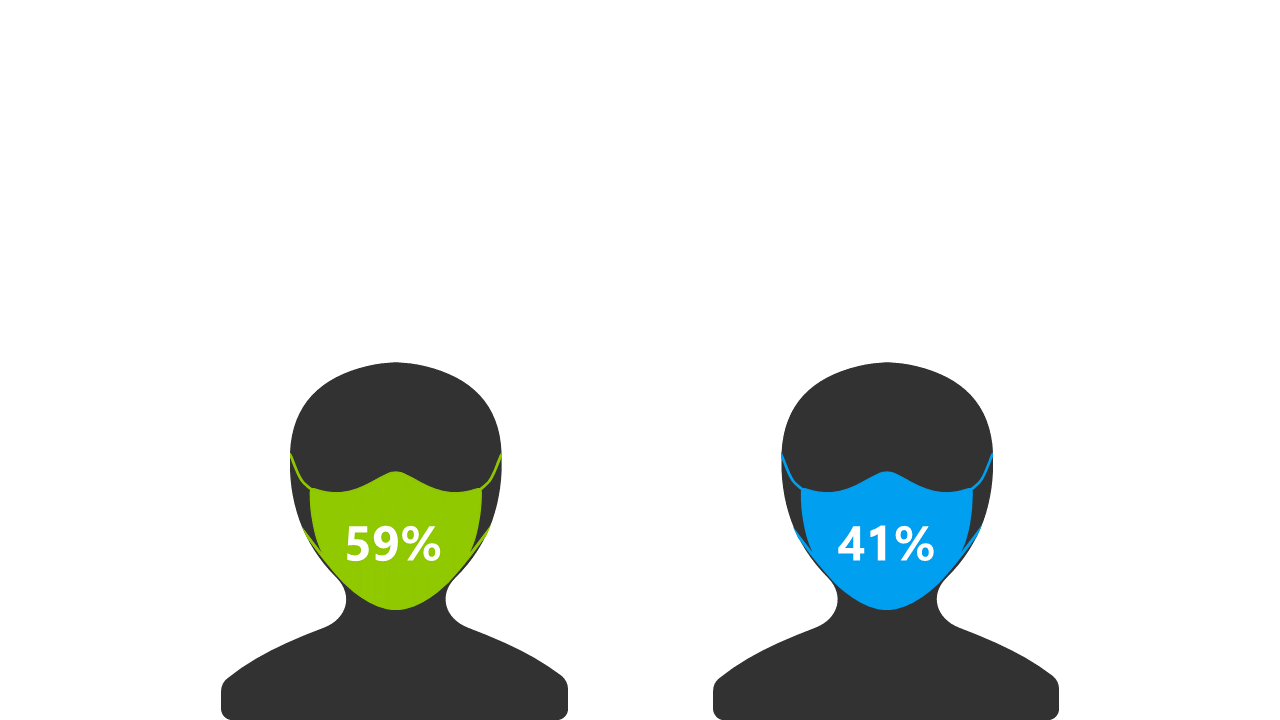
When presenting survey results, clarity and visualization are key to ensuring your audience understands the data. Complicated charts can confuse rather than inform, leaving you looking for a better way to convey your findings. This layout, featuring icons with percentage values displayed on masks, provides a straightforward and engaging way to compare different survey results effectively.
Market researchers and data analysts will find this slide particularly useful in client presentations or team meetings where survey results must be communicated clearly. It’s also great for businesses looking to present consumer feedback in a visually appealing format.
With its clean design, it helps your audience grasp comparative data swiftly, paving the way for insightful discussions. Available for just $0.99, this slide can be downloaded instantly and customized to fit your context. You can easily edit it in PowerPoint or Google Slides, allowing you to adapt the visuals and percentages in just a few minutes for a polished and professional presentation.
$0.99 – Purchase Checkout
Added to cart







